CloudNet@ 가시다님이 진행하는 Istio 스터디 1기 - 4주차 정리 내용 입니다.
앞서 진행했던 주차를 보고 오시면 이해가 빠릅니다.
이번 글에서는 Istio의 Observability(관찰 가능성) 에 대해 알아보고 실습 해보도록 하겠습니다.
✅ 관찰 가능성 란?
관찰 가능성이란, 외부 신호와 특성만 보고도 시스템의 내부 상태를 이해하고 파악할 수 있는 능력을 나타냅니다.
단순한 모니터링보다 한 단계 발전된 개념으로, 문제가 발생했을 때 이유를 파악하고 원인을 추적할 수 있는 수준의 가시성을 확보하는 것을 목표로 합니다.
이렇게 되면, 평균 복구 시간 (Mean Time To Recovery, MTTR) 을 개선하는 데 도움이 됩니다.
이제 Istio에서 관찰 가능성에 대해 알아보겠습니다.
✅ Istio의 Observability 란?
Istio에서 관찰 가능성(Observability) 은 마이크로서비스 간 트래픽을 사이드카 프록시(Envoy)를 통해 처리하면서 다양한 정보를 수집하고, 이를 로그, 메트릭, 트레이스로 내보내는 방식으로 동작합니다.

위 그림을 보면, Istio는 애플리케이션 앞에 사이드카 프록시 (Envoy)가 동작하므로, 애플리케이션 요청의 네트워크 수준에서 관찰 하기 좋습니다.
그렇다고 관찰 가능성이 특정 솔루션을 뜻하는 것이 아니라 다양한 수준을 포함하는 시스템 특성을 뜻 합니다.
✅ 관찰 가능성 vs 모니터링
🔍 개념의 차이
| 항목 | 모니터링(Monitoring) | 관찰 가능성(Observability) |
| 정의 | 미리 정의된 메트릭/알람을 수집하고 확인하는 것 | 시스템 내부 상태를 외부에서 추론할 수 있는 능력 |
| 접근 방식 | "알려진 문제를 감시" | "알려지지 않은 문제의 원인을 탐색" |
| 질문 예시 | CPU가 90%를 넘었는가? | 왜 트래픽 일부가 갑자기 느려졌는가? |
| 도구 사용 예 | Prometheus, Zabbix, Nagios 등 | Grafana + Tracing + Log + APM 등 종합 도구 |
🧠 예시를 통한 이해
- 모니터링 예시
- 웹 서버의 CPU 사용률이 80%를 넘으면 알람을 울려줘
→ 사전에 정의된 조건에 따라 알려주는 것 - 관찰 가능성 예시
- 사용자가 특정 페이지에서만 로딩이 느려짐. CPU도 정상이고 에러도 없음.
이럴 때, 트레이싱/로그/메트릭을 종합해서 원인을 "찾아내는 능력"이 관찰 가능성
이 처럼 관찰 가능성은 모니터링의 부분 집합 이지만,
모니터링에서 확인 할 수 없는 부분까지 상세하게 확인 할 수 있도록 하는 것이 관찰 가능성 입니다.
Istio가 어떻게 관찰 가능성을 돕는가?
앞서 설명 했던 것 처럼 Istio는 애플리케이션의 앞단에 프록시를 통해,
애플리케이션 간 네트워크 요청 경로에 자리하고 있습니다.
따라서 프록시(Envoy)를 통해 요청 처리, 서비스 상호작용에 관련된 메트릭을 포착할 수 있습니다.
ex)
- 주요 메트릭:
- istio_requests_total: 요청 횟수
- istio_request_duration_milliseconds: 지연 시간
이제 실습을 통해 좀 더 자세히 알아보겠습니다.
✅ 실습 환경 준비
🔧 샘플 코드 준비
$ git clone https://github.com/AcornPublishing/istio-in-action

🔧 kind 사용하여 k8s 클러스터 준비
$ kind create cluster --name myk8s --image kindest/node:v1.23.17 --config - <> /root/.bashrc
$ curl -s -L https://istio.io/downloadIstio | ISTIO_VERSION=$ISTIOV sh -
$ cp istio-$ISTIOV/bin/istioctl /usr/local/bin/istioctl
$ istioctl version --remote=false
$ istioctl install --set profile=default -y
$ exit
----------------

🔧 실습을 위한 네임스페이스 생성 및 설정
$ kubectl create ns istioinaction
$ kubectl label namespace istioinaction istio-injection=enabled
$ kubectl get ns --show-labels

🔧 istio-gateway 서비스 Nodeport로 변경 및 Nodport 지정 변경
$ kubectl patch svc -n istio-system istio-ingressgateway -p '{"spec": {"type": "NodePort", "ports": [{"port": 80, "targetPort": 8080, "nodePort": 30000}]}}'
$ kubectl patch svc -n istio-system istio-ingressgateway -p '{"spec": {"type": "NodePort", "ports": [{"port": 443, "targetPort": 8443, "nodePort": 30005}]}}'
$ kubectl patch svc -n istio-system istio-ingressgateway -p '{"spec":{"externalTrafficPolicy": "Local"}}'

🔧 내부 접속 테스트용 파드 생성
$ cat <
🖥️ Istio 메트릭 살펴보기 (실습)
Istio의 데이터 플레인 은 요청을 처리하고, 컨트롤 플레인 은 데이터 플레인이 요청을 처리하도록 설정합니다.
🖥️ 데이터 플레인의 메트릭 - Envoy 표준/상세 메트릭 설정 확인
🔧 catalog, webapp 애플리케이션 생성
$ kubectl apply -f services/catalog/kubernetes/catalog.yaml -n istioinaction
$ kubectl apply -f services/webapp/kubernetes/webapp.yaml -n istioinaction

🔧 gateway, virtualservice 생성
$ kubectl apply -f services/webapp/istio/webapp-catalog-gw-vs.yaml -n istioinaction

🔧 도메인 질의를 위한 DNS 설정
$ echo "127.0.0.1       webapp.istioinaction.io" | sudo tee -a /etc/hosts

🔧 호출 테스트
$ curl -s http://webapp.istioinaction.io:30000/api/catalog | jq

🔧 쿼리를 실행하여 파드의 통계 확인
# 해당 명령어들을 실행하면 프록시가 보관하는 정보들이 나오게 됩니다.
# istio_requests_total 부분이 제일 중요함
# 요청이 들어온 횟수를 나타내줌
$  kubectl exec -it deploy/webapp  -c istio-proxy -n istioinaction -- curl localhost:15000/stats|grep istio_requests_total
$  kubectl exec -it deploy/catalog  -c istio-proxy -n istioinaction -- curl localhost:15000/stats|grep istio_requests_total

결과
istiocustom.istio_requests_total.reporter.destination.source_workload.istio-ingressgateway.source_canonical_service.istio-ingressgateway.source_canonical_revision.latest.source_workload_namespace.istio-system.source_principal.spiffe://cluster.local/ns/istio-system/sa/istio-ingressgateway-service-account.source_app.istio-ingressgateway.source_version.unknown.source_cluster.Kubernetes.destination_workload.webapp.destination_workload_namespace.istioinaction.destination_principal.spiffe://cluster.local/ns/istioinaction/sa/webapp.destination_app.webapp.destination_version.destination_service.webapp.istioinaction.svc.cluster.local.destination_canonical_service.webapp.destination_canonical_revision.latest.destination_service_name.webapp.destination_service_namespace.istioinaction.destination_cluster.Kubernetes.request_protocol.http.response_code.200.grpc_response_status.response_flags.-.connection_security_policy.mutual_tls: 2
istiocustom.istio_requests_total.reporter.source.source_workload.webapp.source_canonical_service.webapp.source_canonical_revision.latest.source_workload_namespace.istioinaction.source_principal.spiffe://cluster.local/ns/istioinaction/sa/webapp.source_app.webapp.source_version.source_cluster.Kubernetes.destination_workload.catalog.destination_workload_namespace.istioinaction.destination_principal.spiffe://cluster.local/ns/istioinaction/sa/catalog.destination_app.catalog.destination_version.v1.destination_service.catalog.istioinaction.svc.cluster.local.destination_canonical_service.catalog.destination_canonical_revision.v1.destination_service_name.catalog.destination_service_namespace.istioinaction.destination_cluster.Kubernetes.request_protocol.http.response_code.200.grpc_response_status.response_flags.-.connection_security_policy.unknown: 2
이번엔 프록시가 Envoy 통계를 더 많이 보고하도록 설정해보겠습니다.
가끔 네트워크 동작을 트러블 슈팅하려면 표준 Istio 메트릭보다 더 많은 정보를 확인해야 될 때가 있습니다.
이럴 때, 더 많은 메트릭 정보를 확인하기 위한 작업을 해보도록 하겠습니다.
- 애플리케이션 호출이 자신의 클라이언트 측 프록시를 거쳐갈 때, 라우팅 결정을 내리고 업스트림 클러스터로 라우팅
- 해당 실습에서는 webapp 서비스가 catalog 서비스로 라우팅
- 업스트림 catalog 서비스 호출에 추가 정보 활성화
🔧 방법 1(IstioOperatordp 명시) : 메시 전체에 적용
# 메시 전체에 수집하는 메트릭을 늘리면 메트릭 수집 시스템을 과부하 상태로 만들 수 있으므로 신중하게 적용 필요
apiVersion: install.istio.io/v1alpha1
kind: IstioOperator
metadata:
  name: control-plane
spec:
  profile: demo
  meshConfig:
    defaultConfig:
      proxyStatsMatcher:
        inclusionPrefixes:
        - "cluster.outbound|80||catalog.istioinaction"

🔧 방법 2(해당 워크로드 별 명시): 워크로드 단위로 설정(애노테이션으로 포함할 메트릭 지정) <- 주로 권장하는 방법
$ cat ch7/webapp-deployment-stats-inclusion.yaml
...
  template:
    metadata:
      annotations:
        proxy.istio.io/config: |-
          proxyStatsMatcher:
            inclusionPrefixes:
            - "cluster.outbound|80||catalog.istioinaction"
      labels:
        app: webapp

$ kubectl apply -n istioinaction -f ch7/webapp-deployment-stats-inclusion.yaml

🔧 호출 테스트
$ curl -s http://webapp.istioinaction.io:30000/api/catalog | jq

🔧 원래 생성했던 webapp Deployment에 "catalog.istioinaction" 도메인에 대한 메트릭 추가가 잘 적용되었는지 확인
$ kubectl exec -it deploy/webapp -c istio-proxy -n istioinaction -- curl localhost:15000/stats | grep catalog

결과
cluster.outbound|80||catalog.istioinaction.svc.cluster.local.upstream_cx_active: 1
cluster.outbound|80||catalog.istioinaction.svc.cluster.local.upstream_cx_close_notify: 0
cluster.outbound|80||catalog.istioinaction.svc.cluster.local.upstream_cx_connect_attempts_exceeded: 0

cluster.outbound|80||catalog.istioinaction.svc.cluster.local.upstream_rq_200: 1
cluster.outbound|80||catalog.istioinaction.svc.cluster.local.upstream_rq_2xx: 1
cluster.outbound|80||catalog.istioinaction.svc.cluster.local.upstream_rq_active: 0

🔧 Envoy는 트래픽을 식별 할 때, 내부 or 외부 인지 구분 합니다.
# 내부는 보통 메시 내부 트래픽이라 인식하는 것을 말하고, 외부는 메시 외부에서 시작한 트래픽(인그레스 게이트웨이로 들어온 트래픽)을 뜻 합니다.
$ kubectl exec -it deploy/webapp -c istio-proxy -n istioinaction -- curl localhost:15000/stats | grep catalog | grep internal

결과
cluster.outbound|80||catalog.istioinaction.svc.cluster.local.internal.upstream_rq_200: 1
cluster.outbound|80||catalog.istioinaction.svc.cluster.local.internal.upstream_rq_2xx: 1
cluster.outbound|80||catalog.istioinaction.svc.cluster.local.internal.upstream_rq_completed: 1
cluster.outbound|80||catalog.istioinaction.svc.cluster.local.upstream_internal_redirect_failed_total: 0
cluster.outbound|80||catalog.istioinaction.svc.cluster.local.upstream_internal_redirect_succeeded_total: 0
cluster.outbound|80||catalog.istioinaction.svc.cluster.local.internal.upstream_rq_time: P0(nan,19) P25(nan,19.25) P50(nan,19.5) P75(nan,19.75) P90(nan,19.9) P95(nan,19.95) P99(nan,19.99) P99.5(nan,19.995) P99.9(nan,19.999) P100(nan,20)

🔧 cluster_name.ssl.* 메트릭은 트래픽이 TLS로 업스트림 클러스터로 이동하는지 여부와 커넥션과 관련된 기타 세부 정보(cipher, curve 등)을 알아내는 데 매우 유용합니다.
$ kubectl exec -it deploy/webapp -c istio-proxy -n istioinaction -- curl localhost:15000/stats | grep catalog | grep ssl

결과
cluster.outbound|80||catalog.istioinaction.svc.cluster.local.client_ssl_socket_factory.downstream_context_secrets_not_ready: 0
cluster.outbound|80||catalog.istioinaction.svc.cluster.local.client_ssl_socket_factory.ssl_context_update_by_sds: 2
cluster.outbound|80||catalog.istioinaction.svc.cluster.local.client_ssl_socket_factory.upstream_context_secrets_not_ready: 0
cluster.outbound|80||catalog.istioinaction.svc.cluster.local.ssl.ciphers.TLS_AES_128_GCM_SHA256: 1
cluster.outbound|80||catalog.istioinaction.svc.cluster.local.ssl.connection_error: 0
cluster.outbound|80||catalog.istioinaction.svc.cluster.local.ssl.curves.X25519: 1
cluster.outbound|80||catalog.istioinaction.svc.cluster.local.ssl.fail_verify_cert_hash: 0
cluster.outbound|80||catalog.istioinaction.svc.cluster.local.ssl.fail_verify_error: 0
cluster.outbound|80||catalog.istioinaction.svc.cluster.local.ssl.fail_verify_no_cert: 0
cluster.outbound|80||catalog.istioinaction.svc.cluster.local.ssl.fail_verify_san: 0
cluster.outbound|80||catalog.istioinaction.svc.cluster.local.ssl.handshake: 1
cluster.outbound|80||catalog.istioinaction.svc.cluster.local.ssl.no_certificate: 0
cluster.outbound|80||catalog.istioinaction.svc.cluster.local.ssl.ocsp_staple_failed: 0
cluster.outbound|80||catalog.istioinaction.svc.cluster.local.ssl.ocsp_staple_omitted: 0
cluster.outbound|80||catalog.istioinaction.svc.cluster.local.ssl.ocsp_staple_requests: 0
cluster.outbound|80||catalog.istioinaction.svc.cluster.local.ssl.ocsp_staple_responses: 0
cluster.outbound|80||catalog.istioinaction.svc.cluster.local.ssl.session_reused: 0
cluster.outbound|80||catalog.istioinaction.svc.cluster.local.ssl.sigalgs.rsa_pss_rsae_sha256: 1
cluster.outbound|80||catalog.istioinaction.svc.cluster.local.ssl.versions.TLSv1.3: 1

🔧 upstream_cx와 upstream_rq는 네트워크에서 일어나는 일에 대한 좀 더 정확한 정보를 제공합니다.
$ kubectl exec -it deploy/webapp -c istio-proxy -n istioinaction -- curl localhost:15000/stats | grep catalog | egrep 'local.upstream_cx|local.upstream_rq'

결과
cluster.outbound|80||catalog.istioinaction.svc.cluster.local.upstream_cx_active: 1
cluster.outbound|80||catalog.istioinaction.svc.cluster.local.upstream_cx_close_notify: 0
cluster.outbound|80||catalog.istioinaction.svc.cluster.local.upstream_cx_connect_attempts_exceeded: 0
cluster.outbound|80||catalog.istioinaction.svc.cluster.local.upstream_rq_timeout: 0
cluster.outbound|80||catalog.istioinaction.svc.cluster.local.upstream_rq_total: 1
cluster.outbound|80||catalog.istioinaction.svc.cluster.local.upstream_rq_tx_reset: 0

🔧 프록시가 알고 있는 모든 백엔드 클러스터에 대한 정보와 엔드포인트를 나열하도록 쿼리 날려보기
# 해당 결과에서 특정 업스트림 클러스터에 대한 자세한 정보 확인 가능
# 앞 선 통계는 클러스터 전체 정보였지만, 아래의 통계 정보는 엔드포인트 별로 자세한 정보를 볼 수 있다.
$ kubectl exec -it deploy/webapp -c istio-proxy -n istioinaction -- curl localhost:15000/clusters | grep catalog

결과
outbound|80||catalog.istioinaction.svc.cluster.local::observability_name::outbound|80||catalog.istioinaction.svc.cluster.local
outbound|80||catalog.istioinaction.svc.cluster.local::default_priority::max_connections::4294967295
outbound|80||catalog.istioinaction.svc.cluster.local::default_priority::max_pending_requests::4294967295
outbound|80||catalog.istioinaction.svc.cluster.local::default_priority::max_requests::4294967295
outbound|80||catalog.istioinaction.svc.cluster.local::default_priority::max_retries::4294967295
outbound|80||catalog.istioinaction.svc.cluster.local::high_priority::max_connections::1024
outbound|80||catalog.istioinaction.svc.cluster.local::high_priority::max_pending_requests::1024
outbound|80||catalog.istioinaction.svc.cluster.local::high_priority::max_requests::1024
outbound|80||catalog.istioinaction.svc.cluster.local::high_priority::max_retries::3
outbound|80||catalog.istioinaction.svc.cluster.local::added_via_api::true
outbound|80||catalog.istioinaction.svc.cluster.local::eds_service_name::outbound|80||catalog.istioinaction.svc.cluster.local
outbound|80||catalog.istioinaction.svc.cluster.local::10.10.0.8:3000::cx_active::1
outbound|80||catalog.istioinaction.svc.cluster.local::10.10.0.8:3000::cx_connect_fail::0
outbound|80||catalog.istioinaction.svc.cluster.local::10.10.0.8:3000::cx_total::1
outbound|80||catalog.istioinaction.svc.cluster.local::10.10.0.8:3000::rq_active::0
outbound|80||catalog.istioinaction.svc.cluster.local::10.10.0.8:3000::rq_error::0
outbound|80||catalog.istioinaction.svc.cluster.local::10.10.0.8:3000::rq_success::1
outbound|80||catalog.istioinaction.svc.cluster.local::10.10.0.8:3000::rq_timeout::0
outbound|80||catalog.istioinaction.svc.cluster.local::10.10.0.8:3000::rq_total::1
outbound|80||catalog.istioinaction.svc.cluster.local::10.10.0.8:3000::hostname::
outbound|80||catalog.istioinaction.svc.cluster.local::10.10.0.8:3000::health_flags::healthy
outbound|80||catalog.istioinaction.svc.cluster.local::10.10.0.8:3000::weight::1
outbound|80||catalog.istioinaction.svc.cluster.local::10.10.0.8:3000::region::
outbound|80||catalog.istioinaction.svc.cluster.local::10.10.0.8:3000::zone::
outbound|80||catalog.istioinaction.svc.cluster.local::10.10.0.8:3000::sub_zone::
outbound|80||catalog.istioinaction.svc.cluster.local::10.10.0.8:3000::canary::false
outbound|80||catalog.istioinaction.svc.cluster.local::10.10.0.8:3000::priority::0
outbound|80||catalog.istioinaction.svc.cluster.local::10.10.0.8:3000::success_rate::-1
outbound|80||catalog.istioinaction.svc.cluster.local::10.10.0.8:3000::local_origin_success_rate::-1
🖥️ 컨트롤 플레인의 메트릭 - citadel, pliot, xds 메트릭 확인
🔧 istiod 파드에 TCP LISTEN Port 확인
$ kubectl exec -it deploy/istiod -n istio-system -- netstat -tnl

결과
Active Internet connections (only servers)
Proto Recv-Q Send-Q Local Address           Foreign Address         State
tcp        0      0 127.0.0.1:9876          0.0.0.0:*               LISTEN
tcp6       0      0 :::8080                 :::*                    LISTEN
tcp6       0      0 :::15017                :::*                    LISTEN
tcp6       0      0 :::15010                :::*                    LISTEN
tcp6       0      0 :::15014                :::*                    LISTEN
tcp6       0      0 :::15012                :::*                    LISTEN

🔧 Istio Control Plane (istiod) 안에 내장된 인증서 관리 서버(Citadel)의 메트릭 확인
$ kubectl exec -it -n istio-system deploy/istiod -n istio-system -- curl localhost:15014/metrics | grep citadel

결과
citadel_server_csr_count 4
citadel_server_root_cert_expiry_timestamp 2.061260669e+09
citadel_server_success_cert_issuance_count 4

🔧 Control Plane(istiod) 버전에 대한 런타임 정보 확인 = istio의 버전정보
$ kubectl exec -it -n istio-system deploy/istiod -n istio-system -- curl localhost:15014/metrics | grep istio_build

결과
istio_build{component="pilot",tag="1.17.8"} 1
위 그림을 보면, 외부에 노출하는 포트마다 각 역할에 대해 설명을 하고 있습니다.
🔌 포트별 설명
| 포트 번호 | 용도 |
| 9876 | ControlZ라는 내부 디버깅 인터페이스로, Istio Pilot 상태를 확인하고 introspection(내부 정보 조회)을 지원 |
| 8080 | istiod 디버그 엔드포인트 (예: /debug, /configz)로, 전체 서비스 메시의 구성 및 상태를 보여줌 |
| 15010 | xDS API 및 인증서 발급 등을 plaintext (암호화되지 않은) 형태로 제공. 보안상 위험 요소 있음 |
| 15012 | 15010과 동일 기능이지만 TLS 및 mTLS 보안이 적용됨 → 기본적으로 Istio는 이 포트를 사용함 |
| 15014 🔴 | Prometheus 같은 툴이 메트릭을 수집(scraping)할 수 있도록 컨트롤 플레인 메트릭 노출 (/metrics 경로) |
| 15017 | 웹훅 서버 포트로, 사이드카 주입 및 리소스 검증(validation) 요청을 처리 |
🔧 	프록시(Envoy)가 Istio의 설정을 얼마나 잘, 얼마나 빨리 수렴했는지 확인
$ kubectl exec -it -n istio-system deploy/istiod -n istio-system -- curl localhost:15014/metrics | grep convergence

결과
pilot_proxy_convergence_time_bucket{le="0.1"} 26 # 0.1초내에 26개의 업데이트가 프록시에 배포돰
pilot_proxy_convergence_time_bucket{le="0.5"} 26
pilot_proxy_convergence_time_bucket{le="1"} 26
pilot_proxy_convergence_time_bucket{le="3"} 26
pilot_proxy_convergence_time_bucket{le="5"} 26
pilot_proxy_convergence_time_bucket{le="10"} 26
pilot_proxy_convergence_time_bucket{le="20"} 26
pilot_proxy_convergence_time_bucket{le="30"} 26
pilot_proxy_convergence_time_bucket{le="+Inf"} 26
pilot_proxy_convergence_time_sum 0.04868068199999999 # 26개의 업데이트 되는데 0.048초 걸림
pilot_proxy_convergence_time_count 26 # 총 업데이트 횟수 26

🔧 컨트롤 플레인에 알려준 서비스 개수, 사용자가 설정한 VirtualService 리소스 개수, 연결된 프록시 개수를 보여주는 명령어
$ kubectl exec -it -n istio-system deploy/istiod -n istio-system -- curl localhost:15014/metrics | grep pilot | egrep 'service|^pilot_xds'

결과
pilot_services 6 # 컨트롤플레인에서 알고 있는 Kubernetes 서비스 개수
pilot_virt_services 1 # 사용자가 생성한 VirtualService 개수
pilot_vservice_dup_domain 0 # 동일한 도메인(host)을 사용하는 중복된 VirtualService가 개수
pilot_xds{version="1.17.8"} 3 # 생성된 Envoy 프록시 개수

🔧 xDS별 업데이트 횟수
$ kubectl exec -it -n istio-system deploy/istiod -n istio-system -- curl localhost:15014/metrics | grep pilot_xds_pushes

결과
pilot_xds_pushes{type="cds"} 31
pilot_xds_pushes{type="eds"} 42
pilot_xds_pushes{type="lds"} 31
pilot_xds_pushes{type="rds"} 21
🖥️ Prometheus 에서 Istio 메트릭 수집 (실습)
Istio의 프록시가 최신 메트릭을 포함하는 엔드포인트를 제공하고 프로메테우스가 그 정보를 끌어올 수 있게 해주겠습니다.
🔧 webapp 파드 정보 확인 및 istiod 파드의 TCP LISTEN Port 정보 확인
$ kubectl exec -it deploy/webapp -n istioinaction -c istio-proxy -- netstat -tnl

결과
Proto Recv-Q Send-Q Local Address           Foreign Address         State
tcp        0      0 0.0.0.0:15021           0.0.0.0:*               LISTEN
tcp        0      0 0.0.0.0:15021           0.0.0.0:*               LISTEN
tcp        0      0 0.0.0.0:15001           0.0.0.0:*               LISTEN
tcp        0      0 0.0.0.0:15001           0.0.0.0:*               LISTEN
tcp        0      0 0.0.0.0:15006           0.0.0.0:*               LISTEN
tcp        0      0 0.0.0.0:15006           0.0.0.0:*               LISTEN
tcp        0      0 0.0.0.0:15090           0.0.0.0:*               LISTEN
tcp        0      0 0.0.0.0:15090           0.0.0.0:*               LISTEN
tcp        0      0 127.0.0.1:15000         0.0.0.0:*               LISTEN
tcp        0      0 127.0.0.1:15004         0.0.0.0:*               LISTEN
tcp6       0      0 :::8080                 :::*                    LISTEN
tcp6       0      0 :::15020                :::*                    LISTEN

🔧 /stats/prometheus는 Prometheus가 수집할 수 있는 포맷으로 메트릭을 보여주는 엔드포인트입니다.
$ kubectl exec -it deploy/webapp -c istio-proxy -n istioinaction -- curl localhost:15090/stats/prometheus

결과
...
envoy_server_initialization_time_ms_bucket{le="5000"} 1
envoy_server_initialization_time_ms_bucket{le="10000"} 1
envoy_server_initialization_time_ms_bucket{le="30000"} 1
envoy_server_initialization_time_ms_bucket{le="60000"} 1
envoy_server_initialization_time_ms_bucket{le="300000"} 1
envoy_server_initialization_time_ms_bucket{le="600000"} 1
envoy_server_initialization_time_ms_bucket{le="1800000"} 1
envoy_server_initialization_time_ms_bucket{le="3600000"} 1
envoy_server_initialization_time_ms_bucket{le="+Inf"} 1
envoy_server_initialization_time_ms_sum{} 98.5
envoy_server_initialization_time_ms_count{} 1
Istio의 Sidecar Proxy(Envoy)와 Pilot Agent가 Pod 내부에서 어떤 포트를 사용하여 트래픽을 처리하고, 메트릭을 노출하며, 헬스 체크와 디버깅 기능을 수행하는지를 시각적으로 잘 정리한 도식입니다.
| 포트 | 구성 요소 | 역할 |
| 15000 | Envoy | Envoy의 관리(Admin) 인터페이스 (예: /stats, /clusters) |
| 15001 | Envoy | Envoy가 애플리케이션의 트래픽을 라우팅 (인바운드/아웃바운드 트래픽 처리) |
| 15006 | Envoy | 인바운드 트래픽을 애플리케이션으로 전달 |
| 15009 | Envoy | Envoy가 생성하는 Prometheus 메트릭 노출 포트 (➡️ curl localhost:15090/stats/prometheus) |
| 15021 | Envoy | Kubernetes Readiness Probe 처리를 위한 포트 |
| 15020 | Pilot Agent | Envoy의 헬스체크 요청을 수신하고, 실제 헬스 상태를 평가 |
| 15004 | Pilot Agent | istiod 디버그 엔드포인트를 노출 (동기화 상태 확인 등) |
| 15053 | Pilot Agent | 로컬 DNS 프록시 (다중 클러스터 환경에서의 DNS 이름 해석 처리) |
이제 kube-prometheus-stack을 설치해보도록 하겠습니다.
🔧 helm repo 추가
$ helm repo add prometheus-community https://prometheus-community.github.io/helm-charts
$ helm repo update

🔧 values.yaml 파일 생성
$ cat << EOF > prom-values-2.yaml
prometheusOperator:
  tls:
    enabled: false
  admissionWebhooks:
    patch:
      enabled: false

prometheus:
  service:
    type: NodePort
    nodePort: 30001

grafana:
  service:
    type: NodePort
    nodePort: 30002
EOF

🔧 설치 진행
$ kubectl create ns prometheus
$ helm install prom prometheus-community/kube-prometheus-stack --version 13.13.1 \
-n prometheus -f ch7/prom-values.yaml -f prom-values-2.yaml

🔧 설치 확인
$ helm list -n prometheus
$ kubectl get-all -n prometheus # krew plugin
$ kubectl get sts,deploy,pod,svc,ep,cm,secret -n prometheus
$ kubectl get crd | grep monitoring
$ kubectl get prometheus,servicemonitors -n prometheus
이제 프로메테우스가 Istio에서 메트릭을 수집하도록 설정해보도록 하겠습니다.
프로메테우스 오퍼레이터의 커스텀 리소스 ServiceMonitor와 PodMonitor를 사용하겠습니다.


🧠 핵심 동작 흐름 요약
- ServiceMonitor가 대상 서비스(my-app)를 지정함
- Prometheus가 ServiceMonitor의 설정을 기반으로 my-app의 /metrics에 주기적으로 요청 보냄
- 이 메트릭은 Prometheus에 저장되고 Grafana 등에서 시각화 가능

🔧 Istio 컨트롤 플레인 구성 요소를 긁어오도록 하는 ServiceMonitor 리소스 설정은 아래와 같습니다.
# Prometheus가 15014 포트에서 컨트롤 플레인 메트릭 수집 할 수 있도록 endpoint에 포트 정의
$ cat ch7/service-monitor-cp.yaml
apiVersion: monitoring.coreos.com/v1
kind: ServiceMonitor
metadata:
  name: istio-component-monitor
  namespace: prometheus
  labels:
    monitoring: istio-components
    release: prom
spec:
  jobLabel: istio
  targetLabels: [app]
  selector:
    matchExpressions:
    - {key: istio, operator: In, values: [pilot]}
  namespaceSelector:
    any: true
  endpoints:
  - port: http-monitoring # 15014
    interval: 15s

🔧 istiod의 Service Spec ServiceMonitor 에서 selector 에 istio=pilot 매칭 확인
$ kubectl describe svc istiod -n istio-system

결과
Port:                     http-monitoring  15014/TCP
TargetPort:               15014/TCP
Endpoints:                10.10.0.5:15014
Session Affinity:         None
Internal Traffic Policy:  Cluster
Events:                   <none>

🔧 ServiceMonitor 적용
$ kubectl apply -f ch7/service-monitor-cp.yaml -n prometheus

🔧 ServiceMonitor 리소스 생성 확인
$ kubectl get servicemonitor -n prometheus

결과
NAME                                                 AGE
istio-component-monitor                              19s
prom-kube-prometheus-stack-grafana                   35m
prom-kube-prometheus-stack-kube-controller-manager   35m
prom-kube-prometheus-stack-operator                  35m
prom-kube-prometheus-stack-prometheus                35m
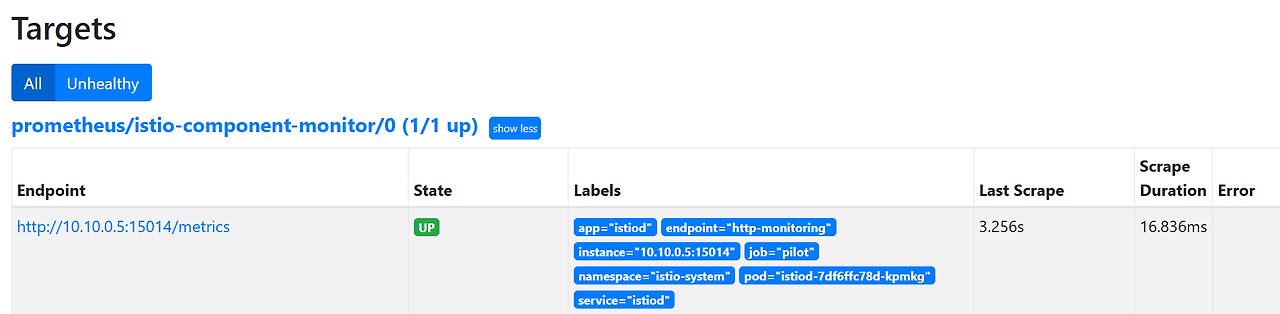
Prometheus 웹에서 Target을 잘 지정했는지 확인
이제 데이터 플레인 수집 활성화 해보겠습니다.
🔧 파드의 애너테이션 정보 확인
$ kubectl describe pod -n istioinaction

결과
Annotations:      kubectl.kubernetes.io/default-container: webapp
                  kubectl.kubernetes.io/default-logs-container: webapp
                  prometheus.io/path: /stats/prometheus
                  prometheus.io/port: 15020
                  prometheus.io/scrape: true
                  proxy.istio.io/config:
                    proxyStatsMatcher:
                      inclusionPrefixes:
                      - "cluster.outbound|80||catalog.istioinaction"
                  sidecar.istio.io/status:
                    {"initContainers":["istio-init"],"containers":["istio-proxy"],"volumes":["workload-socket","credential-socket","workload-certs","istio-env...

🔧 모든 네임스페이스에 존재하는 istio-proxy 컨테이너가 있는 Pod에서 localhost:15090/stats/prometheus 메트릭을 15초 간격으로 수집하여 Prometheus에 저장하도록 설정합니다.
$ cat ch7/pod-monitor-dp.yaml
apiVersion: monitoring.coreos.com/v1
kind: PodMonitor
metadata:
  name: envoy-stats-monitor
  namespace: prometheus
  labels:
    monitoring: istio-proxies
    release: prom
spec:
  selector:
    matchExpressions:
    - {key: istio-prometheus-ignore, operator: DoesNotExist}
  namespaceSelector:
    any: true
  jobLabel: envoy-stats
  podMetricsEndpoints:
  - path: /stats/prometheus
    interval: 15s
    relabelings:
    - action: keep
      sourceLabels: [__meta_kubernetes_pod_container_name]
      regex: "istio-proxy"
    - action: keep
      sourceLabels: [__meta_kubernetes_pod_annotationpresent_prometheus_io_scrape]
    - sourceLabels: [__address__, __meta_kubernetes_pod_annotation_prometheus_io_port]
      action: replace
      regex: ([^:]+)(?::\d+)?;(\d+)
      replacement: $1:$2
      targetLabel: __address__
    - action: labeldrop
      regex: "__meta_kubernetes_pod_label_(.+)"
    - sourceLabels: [__meta_kubernetes_namespace]
      action: replace
      targetLabel: namespace
    - sourceLabels: [__meta_kubernetes_pod_name]
      action: replace
      targetLabel: pod_name

🔧 PodMonitor 리소스 적용
$ kubectl apply -f ch7/pod-monitor-dp.yaml -n prometheus

🔧 metric 확인을 위한 호출테스트
$ while true; do curl -s http://webapp.istioinaction.io:30000/api/catalog ; date "+%Y-%m-%d %H:%M:%S" ; sleep 1; echo; done

🔧 Prometheus가 webapp 파드의 사이드카 프록시에서 메트릭을 정상적으로 수집하는지 확인
$ WEBAPP=$(kubectl get pod -n istioinaction -l app=webapp -o jsonpath='{.items[0].status.podIP}')
$ kubectl exec -it netshoot -- curl -s $WEBAPP:15020/stats/prometheus
$ kubectl exec -it netshoot -- curl -s $WEBAPP:15090/stats/prometheus
Prometheus 웹에서 확인해보면 아래와 같습니다.


🖥️ Istio의 표준 메트릭 수정 (실습)
이번엔 Istio Enovy 사이드카 프록시 에서 몇 가지 플러그인을 사용하여 메트릭이 표시, 커스터마이징, 생성을 해보겠습니다.
먼저 세 가지 개념에 대해 알아보겠습니다.
- 메트릭 (Metric)
- 디멘션 (Dimenstion)
- 속성 (Attribute)
✅ 1. 메트릭 (Metric)
정의:
- 서비스 간 통신에서 수집되는 정량적인 데이터입니다.
- Prometheus 기준으로는 counter, gauge, histogram 혹은 distribution 형식으로 표현됩니다.
예시:
- istio_requests_total : 요청 수
- istio_request_duration_milliseconds : 요청 처리 시간 분포
- istio_request_bytes : 요청 바디 크기
의미: 무엇을 수치화해서 관찰할지 정의한 것이며, 성능 및 트래픽 분석의 기초가 됩니다.
✅ 2. 디멘션 (Dimension)
정의:
- 메트릭을 분류할 기준입니다. 메트릭의 라벨(Label)로 붙으며, 데이터를 필터링하거나 분할 분석할 때 사용됩니다.
예시:
- source_workload, destination_workload
- response_code
- reporter (sidecar인지 gateway인지 구분)
의미:
- "누가 누구에게 어떤 응답코드를 보냈는가?" 같은 맥락(Context)을 추가해주는 역할을 합니다.
✅ 3. 속성 (Attribute)
정의:
- 디멘션을 구성하는 기본 단위 데이터, 보통 Envoy 프록시가 전파하거나 추출하는 키-값 형태의 정보입니다.
예시:
- request.method
- response.code
- destination.service.name
의미:
- 디멘션은 결국 속성에서 파생되며, Envoy 및 Istio가 HTTP 헤더나 메타데이터에서 추출하는 세부 정보입니다.
예시를 통해 알아보면,
istio_requests_total{ # 메트릭 명
response_code="200", # 요청 세부 정보 Request details
reporter="destination", # 메트릭이 누구 관점인가? Point of view of metric
source_workload="istio-ingressgateway",
source_workload_namespace="istio-system",
source_app="istio-ingressgateway", # 호출 주제 Caller
source_version="unknown",
source_cluster="Kubernetes",
destination_workload="webapp",
destination_workload_namespace="istioinaction",
destination_app="webapp", # 호출 대상 Target of call
destination_version="unknown",
destination_service="webapp.istioinaction.svc.cluster.local",
destination_service_name="webapp",
destination_service_namespace="istioinaction",
destination_cluster="Kubernetes",
request_protocol="http",
response_flags="-",
grpc_response_status="",
connection_security_policy="mutual_tls",
source_canonical_service="istio-ingressgateway",
destination_canonical_service="webapp",
source_canonical_revision="latest",
destination_canonical_revision="latest"
} 6 # 호출 개수 Number of calls
위 예시 코드에서 맨위에 있는 것이 메트릭 명 입니다.
istio_requests_total <= 메트릭명그리고 그 안에 들어있는 것 들이 디멘션 입니다.
response_code="200",
reporter="destination",
source_workload="istio-ingressgateway",
source_workload_namespace="istio-system"
등등그리고 속성은 디멘션 값을 생성하는 원천 데이터 입니다.
또한, 동일한 메트릭 명 이지만, 디멘션 중 하나라도 다르면 다른 메트릭으로 표시됩니다.
ex)
istio_requests_total{
response_code="200", # HTTP 200 calls 호출
reporter="destination",
source_workload="istio-ingressgateway",
source_workload_namespace="istio-system",
destination_workload="webapp",
destination_workload_namespace="istioinaction",
request_protocol="http",
connection_security_policy="mutual_tls",
} 5 # Number of HTTP 200 calls 호출 개수

istio_requests_total{
response_code="500", # HTTP 500 calls 호출
reporter="destination",
source_workload="istio-ingressgateway",
source_workload_namespace="istio-system",
destination_workload="webapp",
destination_workload_namespace="istioinaction",
request_protocol="http",
connection_security_policy="mutual_tls",
} 3 # Number of HTTP 500 calls 호출 개수
보면 첫번째 메트릭은 HTTP 200을 호출하지만, 두번째 메트릭은 HTTP 500을 호출하므로 동일한 메트릭명이여도 다른 메트릭으로 생성 됩니다.
속성(attribute)에 대해서 좀 더 자세히 알아보면,
메트릭 안에는 디멘션 값들이 채워져 있는데, 해당 디멘션들의 값들은 Envoy 프록시가 런타임에 갖고 있는 값 인 속성(attribute) 에서 가져옵니다.
Envoy에 기본적으로 어떤 속성들이 있는지는 아래 Envoy 문서를 확인해보면 알 수 있습니다.
이제 속성을 사용하여 기존 메트릭의 디멘션을 커스터마이징 해보겠습니다.
🖥️ 기존 메트릭에 디멘션 추가 (실습)
기본적으로, Istio 메트릭은 Istio를 설치할 때 설치되는 EnvoyFilter 리소스를 사용하여 stats 프록시 플러그인에서 설정합니다.
해당 내용을 알아보기 위해 먼저 Envoyfilter를 확인해줍니다.
🔧 기존에 설정되어있는 envoyfilter 확인
$ kubectl get envoyfilter -n istio-system

결과
NAME                    AGE
stats-filter-1.13       22h
stats-filter-1.14       22h
stats-filter-1.15       22h
stats-filter-1.16       22h
stats-filter-1.17       22h
tcp-stats-filter-1.13   22h
tcp-stats-filter-1.14   22h
tcp-stats-filter-1.15   22h
tcp-stats-filter-1.16   22h
tcp-stats-filter-1.17   22h

🔧 envoyfilter 자세히 알아보기
# 해당 엔보이 필터는 istio.stats 라는 필터를 직접 구성합니다.
# 메트릭 기능을 구현하는 웹 어셈블리 플러그인 입니다.
# 이 웹 어셈블리 필터는 실제로 Envoy 코드베이스 내에서 직접 컴파일되어 NULL 가상머신에서 실행되므로, 웹 어셈블리 가상머신에서 실행되지 않습니다.
$ kubectl get envoyfilter stats-filter-1.13 -n istio-system -o yaml

결과
spec:
  configPatches:
  - applyTo: HTTP_FILTER
    match:
      context: SIDECAR_OUTBOUND
      listener:
        filterChain:
          filter:
            name: envoy.filters.network.http_connection_manager
            subFilter:
              name: envoy.filters.http.router
      proxy:
        proxyVersion: ^1\.13.*
    patch:
      operation: INSERT_BEFORE
      value:
        name: istio.stats # 필터 이름
        typed_config:
          '@type': type.googleapis.com/udpa.type.v1.TypedStruct
          type_url: type.googleapis.com/envoy.extensions.filters.http.wasm.v3.Wasm
          value:
            config: # 필터 설정
              configuration:
                '@type': type.googleapis.com/google.protobuf.StringValue
                value: |
                  {
                    "debug": "false",
                    "stat_prefix": "istio"
                  }
              root_id: stats_outbound
              vm_config:
                code:
                  local:
                    inline_string: envoy.wasm.stats
                runtime: envoy.wasm.runtime.null
                vm_id: stats_outbound

🔧 기존 메트릭에 디멘션을 추가할 내용 확인
# 해당 내용을 확인해보면
# requests_total 메트릭에 upstream_proxy_version: upstream_peer.istio_version 디멘션 추가
# request_protocol 디멘션 삭제
$ cat ch7/metrics/istio-operator-new-dimensions.yaml
apiVersion: install.istio.io/v1alpha1
kind: IstioOperator
spec:
  profile: demo
  values:
    telemetry:	# 텔레메트리 정보
      v2:	# 텔레메트리 버전
        prometheus:
          configOverride:
            inboundSidecar:
              metrics:
              - name: requests_total
                dimensions:	# 추가한 새 디멘션
                  upstream_proxy_version: upstream_peer.istio_version
                  source_mesh_id: node.metadata['MESH_ID']
                tags_to_remove:	# 제거한 태그 목록
                - request_protocol
            outboundSidecar:
              metrics:
              - name: requests_total
                dimensions:
                  upstream_proxy_version: upstream_peer.istio_version
                  source_mesh_id: node.metadata['MESH_ID']
                tags_to_remove:
                - request_protocol
            gateway:
              metrics:
              - name: requests_total
                dimensions:
                  upstream_proxy_version: upstream_peer.istio_version
                  source_mesh_id: node.metadata['MESH_ID']
                tags_to_remove:
                - request_protocol

🔧 기존 설정 확인
# 확인해보면 telemetry 버전 v2 사용하고 있고, prometheus 가 켜져있습니다.
$ kubectl get istiooperator installed-state -n istio-system -o yaml | grep -E "prometheus:|telemetry:" -A2

결과
    telemetry:
      enabled: true
      v2:
--
        prometheus:
          enabled: true
          wasmEnabled: false

🔧 그리고 실제 메트릭 확인
$ kubectl -n istioinaction exec -it deploy/webapp -c istio-proxy \
-- curl localhost:15000/stats/prometheus | grep istio_requests_total

결과
# TYPE istio_requests_total counter
istio_requests_total{reporter="destination",source_workload="istio-ingressgateway",source_canonical_service="istio-ingressgateway",source_canonical_revision="latest",source_workload_namespace="istio-system",source_principal="spiffe://cluster.local/ns/istio-system/sa/istio-ingressgateway-service-account",source_app="istio-ingressgateway",source_version="unknown",source_cluster="Kubernetes",destination_workload="webapp",destination_workload_namespace="istioinaction",destination_principal="spiffe://cluster.local/ns/istioinaction/sa/webapp",destination_app="webapp",destination_version="",destination_service="webapp.istioinaction.svc.cluster.local",destination_canonical_service="webapp",destination_canonical_revision="latest",destination_service_name="webapp",destination_service_namespace="istioinaction",destination_cluster="Kubernetes",request_protocol="http",response_code="200",grpc_response_status="",response_flags="-",connection_security_policy="mutual_tls"} 12153
istio_requests_total{reporter="source",source_workload="webapp",source_canonical_service="webapp",source_canonical_revision="latest",source_workload_namespace="istioinaction",source_principal="spiffe://cluster.local/ns/istioinaction/sa/webapp",source_app="webapp",source_version="",source_cluster="Kubernetes",destination_workload="catalog",destination_workload_namespace="istioinaction",destination_principal="spiffe://cluster.local/ns/istioinaction/sa/catalog",destination_app="catalog",destination_version="v1",destination_service="catalog.istioinaction.svc.cluster.local",destination_canonical_service="catalog",destination_canonical_revision="v1",destination_service_name="catalog",destination_service_namespace="istioinaction",destination_cluster="Kubernetes",request_protocol="http",response_code="200",grpc_response_status="",response_flags="-",connection_security_policy="unknown"} 12153

🔧 설정 적용
$ docker exec -it myk8s-control-plane bash
---
🔧 파일 작성
$ cat << EOF > istio-operator-new-dimensions.yaml
apiVersion: install.istio.io/v1alpha1
kind: IstioOperator
spec:
  profile: demo
  values:
    telemetry:
      v2:
        prometheus:
          configOverride:
            inboundSidecar:
              metrics:
              - name: requests_total
                dimensions:
                  upstream_proxy_version: upstream_peer.istio_version
                  source_mesh_id: node.metadata['MESH_ID']
                tags_to_remove:
                - request_protocol
            outboundSidecar:
              metrics:
              - name: requests_total
                dimensions:
                  upstream_proxy_version: upstream_peer.istio_version
                  source_mesh_id: node.metadata['MESH_ID']
                tags_to_remove:
                - request_protocol
            gateway:
              metrics:
              - name: requests_total
                dimensions:
                  upstream_proxy_version: upstream_peer.istio_version
                  source_mesh_id: node.metadata['MESH_ID']
                tags_to_remove:
                - request_protocol
EOF

🔧 리소스 별로 적용결과 출력
$ istioctl verify-install -f istio-operator-new-dimensions.yaml

🔧 적용
$ istioctl install -f istio-operator-new-dimensions.yaml -y

🔧 적용 후 나가기
$ exit
-----------

🔧 변경된 설정 확인
$ kubectl get istiooperator -n istio-system installed-state -o yaml | grep -E "prometheus:" -A9

결과
        prometheus:
          configOverride:
            gateway:
              metrics:
              - dimensions:
                  source_mesh_id: node.metadata['MESH_ID']
                  upstream_proxy_version: upstream_peer.istio_version
                name: requests_total
                tags_to_remove:
                - request_protocol

🔧 Envoyfilter에서도 변경된 설정 확인
$ kubectl get envoyfilter stats-filter-1.13 -n istio-system -o yaml

결과
spec:
  configPatches:
  - applyTo: HTTP_FILTER
    match:
      context: SIDECAR_OUTBOUND
      listener:
        filterChain:
          filter:
            name: envoy.filters.network.http_connection_manager
            subFilter:
              name: envoy.filters.http.router
      proxy:
        proxyVersion: ^1\.13.*
    patch:
      operation: INSERT_BEFORE
      value:
        name: istio.stats
        typed_config:
          '@type': type.googleapis.com/udpa.type.v1.TypedStruct
          type_url: type.googleapis.com/envoy.extensions.filters.http.wasm.v3.Wasm
          value:
            config:
              configuration:
                '@type': type.googleapis.com/google.protobuf.StringValue
                value: |
                  {"metrics":[{"dimensions":{"source_mesh_id":"node.metadata['MESH_ID']","upstream_proxy_version":"upstream_peer.istio_version"},"name":"requests_total","tags_to_remove":["request_protocol"]}]} # upstream_proxy_version 생성 됨
              root_id: stats_outbound
              vm_config:
                code:
                  local:
                    inline_string: envoy.wasm.stats
                runtime: envoy.wasm.runtime.null
                vm_id: stats_outbound

🔧 나머지 버전에서도 적용되었는지 확인
$ kubectl get envoyfilter stats-filter-1.14 -n istio-system -o yaml | grep MESH_ID
$ kubectl get envoyfilter stats-filter-1.15 -n istio-system -o yaml | grep MESH_ID
$ kubectl get envoyfilter stats-filter-1.16 -n istio-system -o yaml | grep MESH_ID
$ kubectl get envoyfilter stats-filter-1.17 -n istio-system -o yaml | grep MESH_ID
이제 파드에도 적용을 하려고 하는데,
먼저 알아두어야 할 것이 메트릭에서 해당 디멘션을 확인하기 전 Istio의 프록시가 해당 디멘션을 알아야 합니다.
이렇게 하려면 Deployment의 파드 spec에 sidecar.istio.io/extraStatTags 애노테이션을 추가해주어야 합니다.
⚠️ 해당 애노테이션은 Deployment 메타데이터가 아니라 spec.template.metadata 파드 템플릿에 추가 되어야 합니다!
이제 실제로 Deployment에 애너테이션을 추가하여 배포해보도록 하겠습니다.
🔧 Deployment 배포
$ cat ch7/metrics/webapp-deployment-extrastats.yaml
apiVersion: apps/v1
kind: Deployment
metadata:
  labels:
    app: webapp
  name: webapp
spec:
  replicas: 1
  selector:
    matchLabels:
      app: webapp
  template:
    metadata:
      annotations:	# 파드의 애너테이션 부분에 추가된 디멘션 정의
        proxy.istio.io/config: |-
          extraStatTags:
          - "upstream_proxy_version"
          - "source_mesh_id"
      labels:
        app: webapp
    spec:
      containers:
      - env:
        - name: KUBERNETES_NAMESPACE
          valueFrom:
            fieldRef:
              fieldPath: metadata.namespace
        image: istioinaction/webapp:latest
        imagePullPolicy: IfNotPresent
        name: webapp
        ports:
        - containerPort: 8080
          name: http
          protocol: TCP
        securityContext:
          privileged: false

$ kubectl apply -n istioinaction -f ch7/metrics/webapp-deployment-extrastats.yaml

🔧 metric 확인을 위해서 호출 테스트
$ for in in {1..10}; do curl -s http://webapp.istioinaction.io:30000/api/catalog ; sleep 0.5; done

🔧 실제 메트릭 내에 새로운 디멘션이 생겼는지 확인
$ kubectl -n istioinaction exec -it deploy/webapp -c istio-proxy \
-- curl localhost:15000/stats/prometheus | grep istio_requests_total

결과
istio_requests_total{source_mesh_id="cluster.local",upstream_proxy_version="unknown"} 229
istio_requests_total{source_mesh_id="cluster.local",upstream_proxy_version="1.17.8"} 229
Prometheus 웹 UI에서도 확인해보면 아래와 같습니다.

🖥️ 새로운 메트릭 만들어보기 (실습)
앞서 살펴보았던 내용은 기존에 있던 istio_requests_total 메트릭에 디멘션을 추가해보았습니다.
이번엔 새로운 메트릭을 생성해보도록 하겠습니다.
메트릭을 새롭게 생성하려면 stats 플러그인에 새 메트릭을 정의하면 됩니다.
🔧 IstioOperator에 새로운 메트릭 정의
$ cat ch7/metrics/istio-operator-new-metric.yaml
apiVersion: install.istio.io/v1alpha1
kind: IstioOperator
spec:
  profile: demo
  values:
    telemetry:
      v2:
        prometheus:
          configOverride:
            inboundSidecar:
              definitions:
              - name: get_calls
                type: COUNTER
                value: "(request.method.startsWith('GET') ? 1 : 0)"
            outboundSidecar:
              definitions:
              - name: get_calls
                type: COUNTER
                value: "(request.method.startsWith('GET') ? 1 : 0)"
            gateway:
              definitions:
              - name: get_calls
                type: COUNTER
                value: "(request.method.startsWith('GET') ? 1 : 0)"
위 yaml 파일의 내용을 보면, 메트릭 이름을 get_calls 라고 정의를 해두었는데,
실제로는 istio_ 접두사가 자동으로 붙어서 istio_get_calls 라는 이름으로 메트릭이 정의 됩니다.
메트릭의 Type은 COUNTER 로 선택 해두었지만, GAUGE 나 HISTOGRAM 으로도 선택 할 수 있습니다.
메트릭의 값은 CEL(Common Expression Language) 표현식인 문자열로, COUNTER 타입은 정수를 반환해야합니다.
이제 실제로 적용해보도록 하겠습니다.
🔧 설정 적용
$ docker exec -it myk8s-control-plane bash
---
$ cat << EOF > istio-operator-new-metric.yaml
apiVersion: install.istio.io/v1alpha1
kind: IstioOperator
spec:
  profile: demo
  values:
    telemetry:
      v2:
        prometheus:
          configOverride:
            inboundSidecar:
              definitions:
              - name: get_calls
                type: COUNTER
                value: "(request.method.startsWith('GET') ? 1 : 0)"
            outboundSidecar:
              definitions:
              - name: get_calls
                type: COUNTER
                value: "(request.method.startsWith('GET') ? 1 : 0)"
            gateway:
              definitions:
              - name: get_calls
                type: COUNTER
                value: "(request.method.startsWith('GET') ? 1 : 0)"
EOF

🔧 리소스별로 적용결과를 출력
$ istioctl verify-install -f istio-operator-new-metric.yaml

🔧 실제 적용
$ istioctl install -f istio-operator-new-metric.yaml -y

🔧 노드에서 나가기
$ exti
---

🔧 istioOperator에 설정 적용 되었는지 확인
$ kubectl get istiooperator -n istio-system installed-state -o yaml  | grep -A2 get_calls$

결과
              - name: get_calls
                type: COUNTER
                value: '(request.method.startsWith(''GET'') ? 1 : 0)'
--
              - name: get_calls
                type: COUNTER
                value: '(request.method.startsWith(''GET'') ? 1 : 0)'
--
              - name: get_calls
                type: COUNTER
                value: '(request.method.startsWith(''GET'') ? 1 : 0)'

🔧 envoyfilter에도 적용되었는지 확인
$ kubectl get envoyfilter -n istio-system stats-filter-1.13 -o yaml | grep get_calls

결과
{"definitions":[{"name":"get_calls","type":"COUNTER","value":"(request.method.startsWith('GET') ? 1 : 0)"}]}
{"definitions":[{"name":"get_calls","type":"COUNTER","value":"(request.method.startsWith('GET') ? 1 : 0)"}]}
{"definitions":[{"name":"get_calls","type":"COUNTER","value":"(request.method.startsWith('GET') ? 1 : 0)"}]}
새 디멘션은 Istio Proxy에 명시적으로 알려야 했습니다.
그것을 하기 위해 Deployment의 pod.spec 부분에 애너테이션을 추가해주었습니다.
새 메트릭을 만들때도 동일하게 Istio Proxy에 알려야 합니다.
🔧 webapp Deployment 파드 spec에 애너테이션 추가
$ cat ch7/metrics/webapp-deployment-new-metric.yaml
template:
metadata:
annotations:
proxy.istio.io/config: |-
proxyStatsMatcher:
inclusionPrefixes:
- "istio_get_calls"
labels:
app: webapp
$ kubectl -n istioinaction apply -f ch7/metrics/webapp-deployment-new-metric.yaml
🔧 metric 확인을 위한 호출테스트
$ for in in {1..10}; do curl -s http://webapp.istioinaction.io:30000/api/catalog ; sleep 0.5; done
🔧 metric 확인
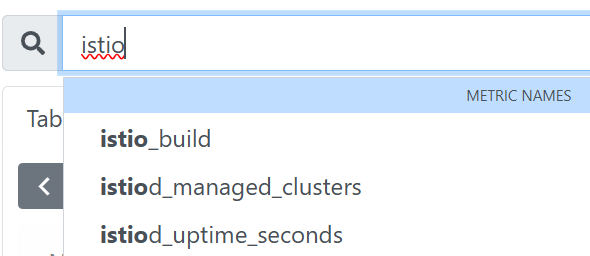
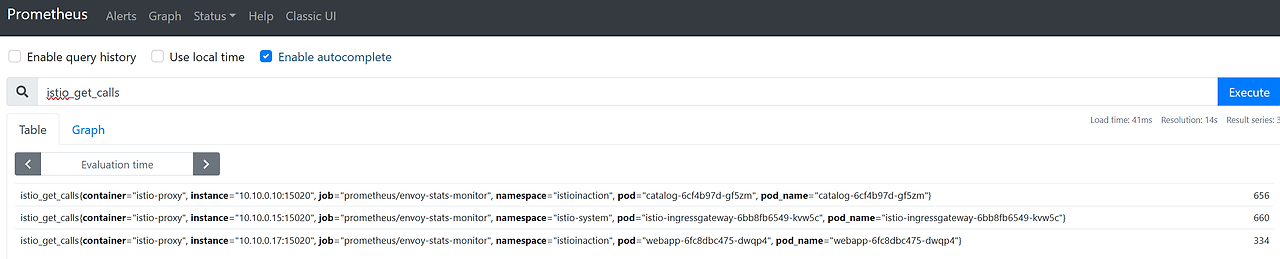
$ kubectl -n istioinaction exec -it deploy/webapp -c istio-proxy -- curl localhost:15000/stats/prometheus | grep istio_get_calls
결과
# TYPE istio_get_calls counter
istio_get_calls{} 110
Prometheus 웹 UI에서도 확인
그런데 메트릭을 보면 디멘션이 기본적인 것들 밖에 없는 것을 확인 할 수 있습니다.
이제 새로운 디멘션을 만들기 위해 속성을 만들어서 디멘션을 추가해보도록 하겠습니다.
🖥️ 새 속성으로 호출 그룹화 하기 (실습)
새 속성을 만들 때, 기존 속성을 기반으로 더 세분화하거나 도메인에 특화하여 만들 수 있습니다.
실습을 통해 구현해보도록 하겠습니다.
🔧 Envoyfilter 리소스로 attribute-gen 플러그인을 구성하는 방법 살펴보기
$ cat ch7/metrics/attribute-gen.yaml
apiVersion: networking.istio.io/v1alpha3
kind: EnvoyFilter
metadata:
  name: attribute-gen-example
  namespace: istioinaction
spec:
  configPatches:
  ## Sidecar Outbound
  - applyTo: HTTP_FILTER
    match:
      context: SIDECAR_OUTBOUND
      listener:
        filterChain:
          filter:
            name: envoy.filters.network.http_connection_manager
            subFilter:
              name: istio.stats
      proxy:
        proxyVersion: ^1\.13.*
    patch:
      operation: INSERT_BEFORE
      value:
        name: istio.attributegen
        typed_config:
          '@type': type.googleapis.com/udpa.type.v1.TypedStruct
          type_url: type.googleapis.com/envoy.extensions.filters.http.wasm.v3.Wasm
          value:
            config:
              configuration:
                '@type': type.googleapis.com/google.protobuf.StringValue
                value: |
                  {
                    "attributes": [
                      {
                        "output_attribute": "istio_operationId", # 속성 이름
                        "match": [
                         {
                           "value": "getitems", # 속성 값
                           "condition": "request.url_path == '/items' && request.method == 'GET'"
                         },
                         {
                           "value": "createitem",
                           "condition": "request.url_path == '/items' && request.method == 'POST'"
                         },
                         {
                           "value": "deleteitem",
                           "condition": "request.url_path == '/items' && request.method == 'DELETE'"
                         }
                       ]
                      }
                    ]
                  }
              vm_config:
                code:
                  local:
                    inline_string: envoy.wasm.attributegen
                runtime: envoy.wasm.runtime.null
위 yaml 파일을 보면, 기본 속성 몇 가지를 조합하여 특정 종류의 호출을 식별할 수 있는 istio_operationId 라는 속성을 만들어 줍니다.
Envoy에 WASM 플러그인 attributegen을 삽입하여,
/items 경로로 들어오는 GET, POST, DELETE 호출에 대해 추적합니다.
이제 새 속성을 만들어 보겠습니다.
🔧 attribute-gen.yaml 파일을 적용하기 전 proxyVersion 확인
$ docker exec -it myk8s-control-plane istioctl version

결과
client version: 1.17.8
control plane version: 1.17.8
data plane version: 1.17.8 (4 proxies)

🔧 proxyVersion 수정
$ vi ch7/metrics/attribute-gen.yaml
      proxy:
        proxyVersion: ^1\.17.* # 수정

🔧 설정 적용
$ kubectl apply -f ch7/metrics/attribute-gen.yaml -n istioinaction

🔧 새롭게 생성된 envoyfilter 확인
$ kubectl get envoyfilter -n istioinaction

결과
NAME                    AGE
attribute-gen-example   85s

🔧 istio_requests_total 메트릭에 새 디멘션 적용
$ docker exec -it myk8s-control-plane bash
---
$ cat << EOF > istio-operator-new-attribute.yaml
apiVersion: install.istio.io/v1alpha1
kind: IstioOperator
spec:
  profile: demo
  values:
    telemetry:
      v2:
        prometheus:
          configOverride:
            outboundSidecar:
              metrics:
              - name: requests_total
                dimensions:
                  upstream_operation: istio_operationId # 새 디멘션
EOF

🔧 리소스별로 적용결과를 출력
$ istioctl verify-install -f istio-operator-new-attribute.yaml

🔧 실제 적용
$ istioctl install -f istio-operator-new-attribute.yaml -y

🔧 노드에서 나가기
$ exit
---

🔧 변경된 설정 확인
$ kubectl get istiooperator -n istio-system installed-state -o yaml | grep -B2 -A1 istio_operationId$

결과
              metrics:
              - dimensions:
                  upstream_operation: istio_operationId
                name: requests_total

🔧 metric 확인을 위한 호출테스트
$ for in in {1..10}; do curl -s http://webapp.istioinaction.io:30000/api/catalog ; sleep 0.5; done

🔧 메트릭 확인
$ kubectl -n istioinaction exec -it deploy/webapp -c istio-proxy -- curl localhost:15000/stats/prometheus | grep istio_requests_total

결과
istio_requests_total{....upstream_operation="getitems"} 459
Prometheus 웹 UI에서 확인해보겠습니다.

이번 글의 내용은 여기 까지 입니다.
다음 글에서는
- Grafana를 사용하여 메트릭을 시각적으로 관찰하기
- Jaeger를 사용하여 분산 트레이싱 계측하기
- Kiail를 사용하여 네트워크 호출 그래프 시각화 하기
를 해보도록 하겠습니다.
감사합니다.
'스터디 > Istio' 카테고리의 다른 글
| Istio 스터디 5주차 - <마이크로서비스 통신 보호 1부> (1) | 2025.05.08 |
|---|---|
| Istio 스터디 4주차 - <Observability 시각화> (1) | 2025.05.03 |
| Istio 스터디 3주차 - <Resilience> (0) | 2025.04.25 |
| Istio 스터디 3주차 - <Traffic Control> (0) | 2025.04.23 |
| Istio 스터디 2주차 - <Envoy와 Istio Gateway 실습> (0) | 2025.04.18 |