반응형
분산 트레이싱이 필요해진 계기
일을 하다보니, K8s 클러스터에서 파드끼리 통신도 하고,
파드 <-> Kafka, SQS에서 message를 받아서 처리하기도 하는데,
실제로 어디서 지연이 발생했는지 파악하기 힘들어서 분산 트레이싱을 통해 원인 파악이 필요하게 되었습니다.
아키텍처
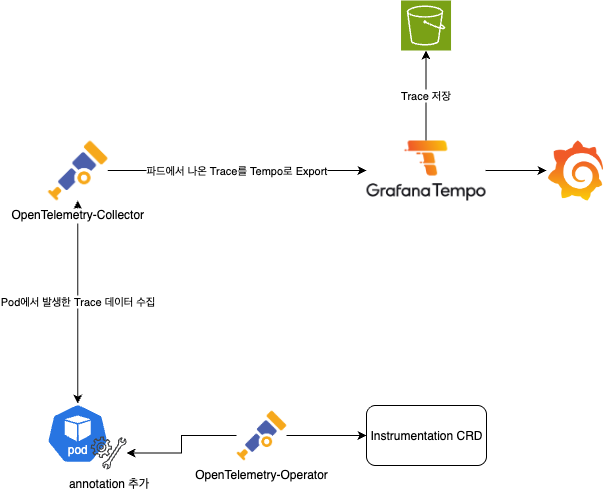
주요 컴포넌트들을 소개 하자면,
OpenTelemetry Operator
- Kubernetes Operator로서, Collector와 auto-instrumentation(자동 계측)을 관리 합니다.
- 이는 Custom Resource(CRD)를 통해 다양한 언어(Java, Python, Go, Node.js, .NET 등)에 자동 계측을 주입할 수 있습니다.
현재 아키텍처에서는
- Instrumentation CRD를 이용해 계측 설정을 정의하고,
- annotation을 사용하여 해당 CRD가 적용될 Pod에 자동으로 트레이싱 로직을 주입을 하고 있습니다.
Instrumentation
- Instrumentation CRD를 통해 exporter endpoint, propagator 설정, sampler 등 계측 관련 설정을 선언할 수 있습니다.
현재 아키텍처에서는
- Instrumentation 리소스에 Collector endpoint를 지정,
- Pod 템플릿에 annotation을 달면 → OpenTelemetry Operator가 annotation을 보고 해당 Pod 내에 자동 계측 에이전트 삽입.
OpenTelemetry Collector
- Collector는 OTLP 데이터를 수집, 가공, 그리고 다른 시스템으로 Export하는 역할을 합니다.
현재 아키텍처에서는
- Pod에서 생성된 trace 데이터를 수집한 뒤, 이를 Grafana Tempo로 Export 하는 역할을 수행합니다.
Grafana Tempo
- 분산 트레이싱 백엔드로서, 고성능, 저비용, 그리고 s3와 같은 객체 스토리지 기반의 확장성을 갖춘 시스템 입니다.
- TraceQL이라는 쿼리 언어, RED 메트릭 생성, Grafana 연동 등을 통해 trace 분석을 지원합니다.
현재 아키텍처에서는
- Collector가 전송한 trace 데이터를 Tempo가 받아 저장합니다.
- Tempo는 Object Storage(예: S3)에 trace를 저장하며, 이후 Grafana가 이 데이터를 조회 및 시각화할 수 있게 합니다.
Grafana
- Grafana는 다양한 데이터 소스를 시각화할 수 있는 모니터링 플랫폼 입니다.
현재 아키텍처에서는
- Grafana는 Tempo에 저장된 trace를 불러와, 대시보드 형태로 사용자에게 trace 흐름, latency, 오류 등을 직관적으로 보여주는 UI 역할을 합니다.
사전 준비
- k8s 클러스터
- helm 차트
- Grafana 설치
- s3와 같은 객체 스토리지
1. tempo 설치
저 같은 경우에는 helm 차트를 사용하여 설치를 진행하였습니다.
- grafana 헬름 repo 추가
helm repo add grafana https://grafana.github.io/helm-charts- values.yaml 파일 내용 수정
tempo:
    queryFrontend:
        search:
            max_spans_per_span_set: 1000 # 하나의 Trace에 최대 1000개의 span까지 쿼리 할 수 있도록 설정
    storage:
        trace:
            backend: s3
            s3:
                access_key: "s3에 접근할 수 있는 access_key"
                secret_key: "s3에 접근할 수 있는 secret_key"
                bucket: s3 버킷의 이름
                endpoint: s3 버킷의 엔드포인트
                region: s3 버킷이 존재하는 리전
insecure: false - tempo 설치
helm install tempo grafana/tempo --version 1.23.3 -f values.yaml2. opentelemetry-collector 설치
- opentelemetry 헬름 repo 추가
helm repo add opentelemetry-helm https://open-telemetry.github.io/opentelemetry-helm-charts- values.yaml 파일 내용 수정
mode: "deployment, daemonset, statefulset 중 원하는 걸로 선택"
config:
    exporters:
        otlp:
            endpoint: 앞서 설치한 tempo 서비스 주소:4317 # collector가 수집한 trace를 tempo로 보내기 위한 tempo 주소
            tls:
                insecure: true # 테스트 용도로 사용하기 위해 insecure 설정을 true 해주었습니다.
    service:
        pipelines:
            traces:
                exporters:
- otlp- opentelemetry-collector 설치
helm install opentelemetry-collector opentelemetry-helm/opentelemetry-collector --version 0.130.2 -f values.yaml3. opentelemetry-operator 설치
- opentelemetry 헬름 repo 추가
helm repo add opentelemetry-helm https://open-telemetry.github.io/opentelemetry-helm-charts- values.yaml 파일 내용 수정
admissionWebhooks:
    certManager:
        enabled: false
    autoGenerateCert
        enabled: true
이렇게 하면 자체 서명된 인증서와 비밀번호가 있는 OpenTelemetry Operator가 설치됩니다.
- opentelemetry-operator 설치
helm install opentelemetry-operator opentelemetry-helm/opentelemetry-operator --version 0.93.0 -f values.yaml4. Instrumentation 리소스 생성
- Node.js 애플리케이션에 자동 계측을 위한 Instrumentation 리소스 생성
apiVersion: opentelemetry.io/v1alpha1
kind: Instrumentation
metadata:
  name: node-auto
  namespace: ## 중요. 계측하고 싶은 파드와 같은 네임스페이스에 존재해야함 ##
spec:
  exporter:
    endpoint: http://opentelemetry-collector의 내부 서비스 주소:4318
  propagators:
    - tracecontext               # W3C Trace Context: 분산 추적 표준 헤더 형식, 쉽게 설명해서 해당 요청이 어느 Trace에 속하는지 알려주는 ID 전파
    - baggage                  # W3C Baggage: 키-값 형태의 사용자 정의 메타데이터 전파, 쉽게 설명해서 추가적인 컨텍스트(부가 데이터)도 같이 전달
  sampler:
    type: parentbased_traceidratio
    argument: "0.05"              # 샘플링 비율 조정 (0.05 = 5%)
                                  # 샘플링 비율을 너무 높여 놓으면, tempo 파드의 리소스가 기하급수적으로 증가하게 되니 조심
5. Pod/Deployment 리소스에 애노테이션 추가
애플리케이션 코드에 직접 OpenTelemetry SDK를 넣지 않아도,
Pod/Deployment에 어노테이션만 붙이면 Operator가 이 Instrumentation 리소스에 정의된 설정대로 계측 에이전트를 주입합니다.
- 예시 (Deployment)
apiVersion: apps/v1
kind: Deployment
metadata:
  name: my-nodejs-app
  namespace: default
spec:
  replicas: 2
  selector:
    matchLabels:
      app: my-nodejs-app
  template:
    metadata:
      labels:
        app: my-nodejs-app
      annotations:
        # ✅ OpenTelemetry Operator에게 Node.js 오토 인스트루먼트 주입 요청
        instrumentation.opentelemetry.io/inject-nodejs: "true"
        # (선택) 특정 Instrumentation CR을 지정할 수도 있음
        # instrumentation.opentelemetry.io/inject-nodejs: "my-nodejs-instrumentation"
    spec:
      containers:
        - name: app
          image: my-nodejs-app:latest
          ports:
- containerPort: 3000- 예시 (Pod)
apiVersion: v1
kind: Pod
metadata:
  name: my-nodejs-pod
  namespace: default
  annotations:
    # ✅ Node.js 자동 계측 활성화
    instrumentation.opentelemetry.io/inject-nodejs: "true"
spec:
  containers:
    - name: app
      image: my-nodejs-app:latest
      ports:
        - containerPort: 3000
6. 결과 확인
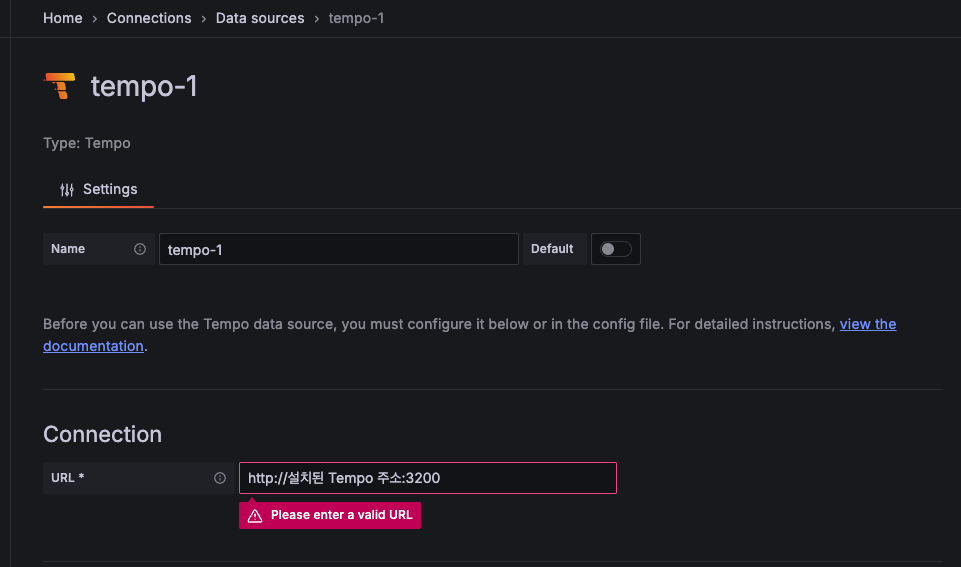
Grafana에 접속한 후, Data source에 Tempo를 추가해줍니다.
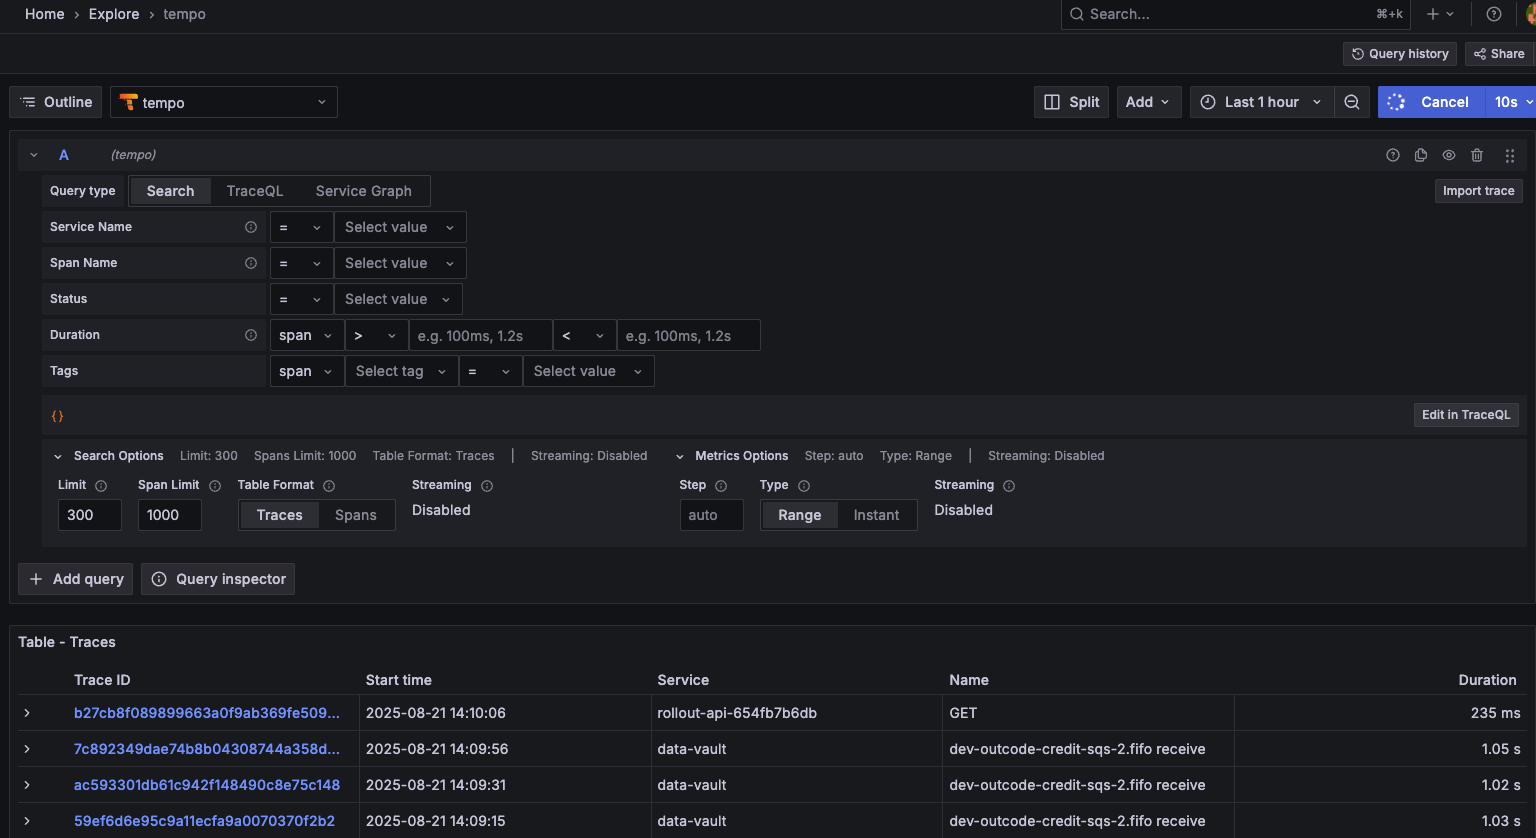
그리고 Explore 메뉴 에 가서 Run query 를 했을 때, 아래에 Trace가 나오면 됩니다.
이상 입니다.
감사합니다.
반응형
'Monitoring' 카테고리의 다른 글
| Tempo를 사용하여 Service Graph 만들기 (0) | 2025.11.05 |
|---|---|
| OpenTelemetry Collector 샘플링 튜닝: 원하는 트레이스를 잡아내는 방법 (0) | 2025.08.26 |
| Alertmanager <-> Googlechat 으로 알람 보내기 (0) | 2025.08.11 |
| Istio ingressgateway 와 ALB 연결 (0) | 2025.07.24 |
| Istio, Kiali 설치 및 Prometheus, Grafana 연결 (Using Helm) (3) | 2025.07.24 |