이번엔 Strimzi Kafka 를 설치하고 모니터링 하는 방법에 대해 알아보겠습니다.
먼저 Strimzi Kafka가 설치가 되어있어야 합니다.
설치가이드
jmxPrometheusExporter 설정
먼저 jmxPrometheusExporter 설정을 해주어야 합니다.
앞서 설치가이드에서 설치를 할 때 정의해둔 Kafka 리소스 YAML 파일을 살펴보겠습니다.
apiVersion: kafka.strimzi.io/v1beta2
kind: Kafka
metadata:
  name: kafka-cluster
  namespace: kafka-operator
  annotations:
    strimzi.io/node-pools: enabled
    strimzi.io/kraft: enabled
spec:
  kafka:
    version: 4.0.0
    metadataVersion: 4.0-IV3
    metricsConfig: # 여기 부분 중요
      type: jmxPrometheusExporter
      valueFrom:
        configMapKeyRef: # 여기 부분 중요
          name: kafka-metrics
key: kafka-metrics-config.yml- metricsConfig: metricsConfig 를 Kafka CR에서 정의하는 이유는 Strimzi가 Kafka Pod 실행 시 JVM 옵션에 JMX Exporter Java Agent 를 삽입하기 위해서 입니다.
- configMapKeyRef: Prometheus JMX Exporter를 통해 Prometheus 형식의 메트릭을 Grafana 대시보드로 내보내기 위한 규칙을 ConfigMap 리소스로 정의를 합니다.
ConfigMap 리소스 정의
이제 JMX Exporter를 통해 나온 메트릭을 Prometheus가 이해할 수 있는 형태로 변환하는 규칙을 담고 있는 ConfigMap을 만들어 보겠습니다.
kind: ConfigMap
apiVersion: v1
metadata:
  name: kafka-metrics
  namespace: kafka-operator
  labels:
    app: strimzi
data:
  kafka-metrics-config.yml: |
    # See https://github.com/prometheus/jmx_exporter for more info about JMX Prometheus Exporter metrics
    lowercaseOutputName: true
    rules:
    # Special cases and very specific rules
    - pattern: kafka.server<type=(.+), name=(.+), clientId=(.+), topic=(.+), partition=(.*)><>Value
      name: kafka_server_$1_$2
      type: GAUGE
      labels:
        clientId: "$3"
        topic: "$4"
        partition: "$5"
    - pattern: kafka.server<type=(.+), name=(.+), clientId=(.+), brokerHost=(.+), brokerPort=(.+)><>Value
      name: kafka_server_$1_$2
      type: GAUGE
      labels:
        clientId: "$3"
        broker: "$4:$5"
    - pattern: kafka.server<type=(.+), cipher=(.+), protocol=(.+), listener=(.+), networkProcessor=(.+)><>connections
      name: kafka_server_$1_connections_tls_info
      type: GAUGE
      labels:
        cipher: "$2"
        protocol: "$3"
        listener: "$4"
        networkProcessor: "$5"
    - pattern: kafka.server<type=(.+), clientSoftwareName=(.+), clientSoftwareVersion=(.+), listener=(.+), networkProcessor=(.+)><>connections
      name: kafka_server_$1_connections_software
      type: GAUGE
      labels:
        clientSoftwareName: "$2"
        clientSoftwareVersion: "$3"
        listener: "$4"
        networkProcessor: "$5"
    - pattern: "kafka.server<type=(.+), listener=(.+), networkProcessor=(.+)><>(.+-total):"
      name: kafka_server_$1_$4
      type: COUNTER
      labels:
        listener: "$2"
        networkProcessor: "$3"
    - pattern: "kafka.server<type=(.+), listener=(.+), networkProcessor=(.+)><>(.+):"
      name: kafka_server_$1_$4
      type: GAUGE
      labels:
        listener: "$2"
        networkProcessor: "$3"
    - pattern: kafka.server<type=(.+), listener=(.+), networkProcessor=(.+)><>(.+-total)
      name: kafka_server_$1_$4
      type: COUNTER
      labels:
        listener: "$2"
        networkProcessor: "$3"
    - pattern: kafka.server<type=(.+), listener=(.+), networkProcessor=(.+)><>(.+)
      name: kafka_server_$1_$4
      type: GAUGE
      labels:
        listener: "$2"
        networkProcessor: "$3"
    # Some percent metrics use MeanRate attribute
    # Ex) kafka.server<type=(KafkaRequestHandlerPool), name=(RequestHandlerAvgIdlePercent)><>MeanRate
    - pattern: kafka.(\w+)<type=(.+), name=(.+)Percent\w*><>MeanRate
      name: kafka_$1_$2_$3_percent
      type: GAUGE
    # Generic gauges for percents
    - pattern: kafka.(\w+)<type=(.+), name=(.+)Percent\w*><>Value
      name: kafka_$1_$2_$3_percent
      type: GAUGE
    - pattern: kafka.(\w+)<type=(.+), name=(.+)Percent\w*, (.+)=(.+)><>Value
      name: kafka_$1_$2_$3_percent
      type: GAUGE
      labels:
        "$4": "$5"
    # Generic per-second counters with 0-2 key/value pairs
    - pattern: kafka.(\w+)<type=(.+), name=(.+)PerSec\w*, (.+)=(.+), (.+)=(.+)><>Count
      name: kafka_$1_$2_$3_total
      type: COUNTER
      labels:
        "$4": "$5"
        "$6": "$7"
    - pattern: kafka.(\w+)<type=(.+), name=(.+)PerSec\w*, (.+)=(.+)><>Count
      name: kafka_$1_$2_$3_total
      type: COUNTER
      labels:
        "$4": "$5"
    - pattern: kafka.(\w+)<type=(.+), name=(.+)PerSec\w*><>Count
      name: kafka_$1_$2_$3_total
      type: COUNTER
    # Generic gauges with 0-2 key/value pairs
    - pattern: kafka.(\w+)<type=(.+), name=(.+), (.+)=(.+), (.+)=(.+)><>Value
      name: kafka_$1_$2_$3
      type: GAUGE
      labels:
        "$4": "$5"
        "$6": "$7"
    - pattern: kafka.(\w+)<type=(.+), name=(.+), (.+)=(.+)><>Value
      name: kafka_$1_$2_$3
      type: GAUGE
      labels:
        "$4": "$5"
    - pattern: kafka.(\w+)<type=(.+), name=(.+)><>Value
      name: kafka_$1_$2_$3
      type: GAUGE
    # Emulate Prometheus 'Summary' metrics for the exported 'Histogram's.
    # Note that these are missing the '_sum' metric!
    - pattern: kafka.(\w+)<type=(.+), name=(.+), (.+)=(.+), (.+)=(.+)><>Count
      name: kafka_$1_$2_$3_count
      type: COUNTER
      labels:
        "$4": "$5"
        "$6": "$7"
    - pattern: kafka.(\w+)<type=(.+), name=(.+), (.+)=(.*), (.+)=(.+)><>(\d+)thPercentile
      name: kafka_$1_$2_$3
      type: GAUGE
      labels:
        "$4": "$5"
        "$6": "$7"
        quantile: "0.$8"
    - pattern: kafka.(\w+)<type=(.+), name=(.+), (.+)=(.+)><>Count
      name: kafka_$1_$2_$3_count
      type: COUNTER
      labels:
        "$4": "$5"
    - pattern: kafka.(\w+)<type=(.+), name=(.+), (.+)=(.*)><>(\d+)thPercentile
      name: kafka_$1_$2_$3
      type: GAUGE
      labels:
        "$4": "$5"
        quantile: "0.$6"
    - pattern: kafka.(\w+)<type=(.+), name=(.+)><>Count
      name: kafka_$1_$2_$3_count
      type: COUNTER
    - pattern: kafka.(\w+)<type=(.+), name=(.+)><>(\d+)thPercentile
      name: kafka_$1_$2_$3
      type: GAUGE
      labels:
        quantile: "0.$4"
    # KRaft overall related metrics
    # distinguish between always increasing COUNTER (total and max) and variable GAUGE (all others) metrics
    - pattern: "kafka.server<type=raft-metrics><>(.+-total|.+-max):"
      name: kafka_server_raftmetrics_$1
      type: COUNTER
    - pattern: "kafka.server<type=raft-metrics><>(current-state): (.+)"
      name: kafka_server_raftmetrics_$1
      value: 1
      type: UNTYPED
      labels:
        $1: "$2"
    - pattern: "kafka.server<type=raft-metrics><>(.+):"
      name: kafka_server_raftmetrics_$1
      type: GAUGE
    # KRaft "low level" channels related metrics
    # distinguish between always increasing COUNTER (total and max) and variable GAUGE (all others) metrics
    - pattern: "kafka.server<type=raft-channel-metrics><>(.+-total|.+-max):"
      name: kafka_server_raftchannelmetrics_$1
      type: COUNTER
    - pattern: "kafka.server<type=raft-channel-metrics><>(.+):"
      name: kafka_server_raftchannelmetrics_$1
      type: GAUGE
    # Broker metrics related to fetching metadata topic records in KRaft mode
    - pattern: "kafka.server<type=broker-metadata-metrics><>(.+):"
      name: kafka_server_brokermetadatametrics_$1
      type: GAUGE
        # --- JVM metrics mapping (추가) ---
    - pattern: 'java.lang<type=Memory><HeapMemoryUsage>(used|committed|max)'
      name: jvm_memory_bytes_heap_$1
      type: GAUGE
    - pattern: 'java.lang<type=Memory><NonHeapMemoryUsage>(used|committed|max)'
      name: jvm_memory_bytes_nonheap_$1
      type: GAUGE
    - pattern: 'java.lang<type=MemoryPool, name=(.+)><Usage>(used|committed|max)'
      name: jvm_memory_pool_bytes_$2
      type: GAUGE
      labels:
        pool: "$1"

    - pattern: 'java.lang<type=GarbageCollector, name=(.+)><>CollectionTime'
      name: jvm_gc_collection_seconds_sum
      type: COUNTER
      labels: { gc: "$1" }
    - pattern: 'java.lang<type=GarbageCollector, name=(.+)><>CollectionCount'
      name: jvm_gc_collection_seconds_count
      type: COUNTER
      labels: { gc: "$1" }

    - pattern: 'java.lang<type=Threading><>ThreadCount'
      name: jvm_threads_count
      type: GAUGE
    - pattern: 'java.lang<type=OperatingSystem><>OpenFileDescriptorCount'
      name: jvm_open_file_descriptors
      type: GAUGE
    - pattern: 'java.lang<type=OperatingSystem><>MaxFileDescriptorCount'
      name: jvm_max_file_descriptors
      type: GAUGE
    # --- JVM metrics mapping (끝) ---
하나씩 뜯어서 설명을 해보자면,
공통 설정: lowercaseOutputName: true
lowercaseOutputName: true- 결과 메트릭 이름을 전부 소문자로 강제
- 예를 들어, 원래라면
kafka_server_BrokerTopicMetrics_BytesInPerSec_total해당 메트릭 이름을kafka_server_brokertopicmetrics_bytesinpersec_total이렇게 소문자화 시켜줍니다. - prometheus & grafana 쪽에서 일관된 네이밍을 위해 켜두는 옵션
rule의 기본 구조
- pattern: <JMX MBean 패턴>
  name: <Prometheus 메트릭 이름 템플릿>
  type: GAUGE | COUNTER | UNTYPED
  labels:
    <라벨 키>: "<라벨 값 템플릿>"
value: <값 템플릿> # (옵션)- pattern: JMX MBean 이름 + attribute 를 정규식으로 매칭
- name: 매칭된 그룹을 이용해서 Prometheus 메트릭 이름 생성
- labels: MBean에 포함된 필드를 라벨로 뽑음
- type: 메트릭 타입
- COUNTER: 계속 증가하는 값
- GAUGE: 왔다 갔다 하는 값
- UNTYPED: 타입이 애매할 때 사용
몇가지 중요한 설정을 설명하자면,
토픽 / 파티션 단위 지표
- pattern: kafka.server<type=(.+), name=(.+), clientId=(.+), topic=(.+), partition=(.*)><>Value
  name: kafka_server_$1_$2
  type: GAUGE
  labels:
    clientId: "$3"
    topic: "$4"
partition: "$5"- Kafka JMX 중 type=.. name=.. clientId=.. topic=.. partition=.. 이런 형태로 나오는 메트릭을 잡아서 Prometheus가 수집할 수 있는 메트릭으로 바꿔줍니다.
- 주로 토픽/파티션 별 lag, fetch 시간, replication 상태 등을 볼 수 있습니다.
리스너 / 네트워크 단위 트래픽 / 요청 카운터
- pattern: "kafka.server<type=(.+), listener=(.+), networkProcessor=(.+)><>(.+-total):"
  name: kafka_server_$1_$4
  type: COUNTER
  labels:
    listener: "$2"
networkProcessor: "$3"- ...-total로 끝나는 값 -> COUNTER 로 변환
- 예: RequestBytesInTotal, BytesOutTotal 같은 애들
- 리스너(PLAINTEXT, SSL 등) 별, 네트워크 스레드 별로 요청 수 / 바이트 수 총량을 볼 수 있습니다.
- 이걸 Prometheus에서 rate()로 감싸면 초당 트래픽량, 초당 요청 수(RPS) 그래프를 만들 수 있습니다.
이제 각 설정에 대한 설명은 여기까지하고, Prometheus가 이렇게 변환된 메트릭을 어떻게 수집할 수 있게하는 지에 대해 알아보겠습니다.
Podmonitor 설정
PodMonitor는 Prometheus가 Pod 자체를 직접 스크랩하도록 정의하는 리소스이며, ServiceMonitor의 Pod 버전이라고 보면 됩니다.
저흰 Prometheus 메트릭을 스크랩 할 수 있는 포트를 POD에만 정의를 해두고 Service에는 정의 하지 않아서 PodMonitor를 사용 하겠습니다.
PodMonitor 설정
apiVersion: monitoring.coreos.com/v1
kind: PodMonitor
metadata:
  name: kafka-podmonitor
  namespace: kafka-operator            # ← Prometheus가 감시하는 NS
  labels:
    release: monitor            # ← 당신의 Prometheus 릴리스 라벨에 맞추세요
spec:
  namespaceSelector:
    matchNames: ["kafka-operator"] # ← Kafka가 있는 NS
  selector:
    matchLabels:                   # ← Kafka 서비스에 공통으로 붙는 라벨
      strimzi.io/cluster: kafka-cluster
      strimzi.io/component-type: kafka
  podMetricsEndpoints:
    - targetPort: 9404           # POD에서 메트릭을 스크랩 할 수 있도록 열어둔 포트와 경로
      path: /metrics
      interval: 30s
      scrapeTimeout: 10s
이제 Prometheus UI에서 정상적으로 메트릭을 수집하나 확인해보겠습니다.
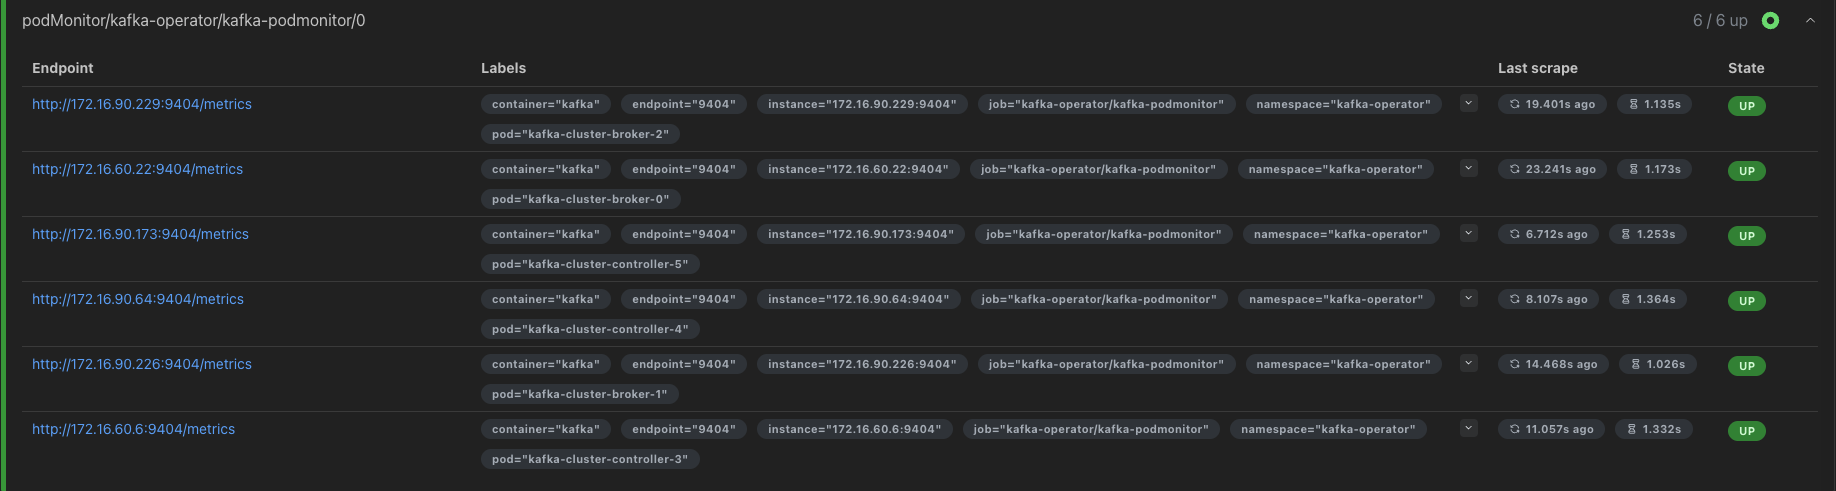
정상적으로 수집을 하는 것을 확인할 수 있습니다.
이제 마지막으로 대시보드를 생성해보도록 하겠습니다.
모니터링 대시보드 생성
Grafana에 접속해서 Dashboard 메뉴에 들어가서 Import 누르고 Json 코드 넣는 부분에 아래와 같이 넣어주면 됩니다.
{
"annotations": {
"list": [
{
"builtIn": 1,
"datasource": {
"type": "datasource",
"uid": "grafana"
},
"enable": true,
"hide": true,
"iconColor": "rgba(0, 211, 255, 1)",
"name": "Annotations & Alerts",
"type": "dashboard"
}
]
},
"editable": true,
"fiscalYearStartMonth": 0,
"graphTooltip": 0,
"id": 125,
"links": [],
"panels": [
{
"datasource": "${DS_PROMETHEUS}",
"description": "브로커 노드 개수",
"fieldConfig": {
"defaults": {
"color": {
"mode": "thresholds"
},
"mappings": [
{
"options": {
"match": "null",
"result": {
"text": "N/A"
}
},
"type": "special"
}
],
"thresholds": {
"mode": "absolute",
"steps": [
{
"color": "#d44a3a"
},
{
"color": "rgba(237, 129, 40, 0.89)",
"value": 0
},
{
"color": "#299c46",
"value": 2
}
]
},
"unit": "none"
},
"overrides": []
},
"gridPos": {
"h": 4,
"w": 3,
"x": 0,
"y": 0
},
"id": 46,
"maxDataPoints": 100,
"options": {
"colorMode": "value",
"graphMode": "none",
"justifyMode": "auto",
"orientation": "horizontal",
"percentChangeColorMode": "standard",
"reduceOptions": {
"calcs": [
"lastNotNull"
],
"fields": "",
"values": false
},
"showPercentChange": false,
"textMode": "auto",
"wideLayout": true
},
"pluginVersion": "12.0.2",
"targets": [
{
"datasource": "${DS_PROMETHEUS}",
"expr": "count(kafka_server_replicamanager_leadercount{namespace=\"$kubernetes_namespace\",strimzi_io_cluster=\"$strimzi_cluster_name\"})",
"format": "time_series",
"hide": false,
"intervalFactor": 1,
"legendFormat": "",
"refId": "A"
}
],
"title": "Brokers Online",
"type": "stat"
},
{
"datasource": "${DS_PROMETHEUS}",
"description": "Number of active controllers in the cluster",
"fieldConfig": {
"defaults": {
"color": {
"mode": "thresholds"
},
"mappings": [
{
"options": {
"match": "null",
"result": {
"text": "N/A"
}
},
"type": "special"
}
],
"thresholds": {
"mode": "absolute",
"steps": [
{
"color": "#299c46"
},
{
"color": "#e5ac0e",
"value": 2
},
{
"color": "#bf1b00"
}
]
},
"unit": "none"
},
"overrides": []
},
"gridPos": {
"h": 4,
"w": 3,
"x": 3,
"y": 0
},
"id": 36,
"maxDataPoints": 100,
"options": {
"colorMode": "value",
"graphMode": "none",
"justifyMode": "auto",
"orientation": "horizontal",
"percentChangeColorMode": "standard",
"reduceOptions": {
"calcs": [
"lastNotNull"
],
"fields": "",
"values": false
},
"showPercentChange": false,
"textMode": "auto",
"wideLayout": true
},
"pluginVersion": "12.0.2",
"targets": [
{
"datasource": "${DS_PROMETHEUS}",
"expr": "sum(kafka_controller_kafkacontroller_activecontrollercount{namespace=\"$kubernetes_namespace\",strimzi_io_cluster=\"$strimzi_cluster_name\"})",
"format": "time_series",
"hide": false,
"intervalFactor": 1,
"refId": "A"
}
],
"title": "Active Controllers",
"type": "stat"
},
{
"datasource": "${DS_PROMETHEUS}",
"description": "Unclean leader election rate",
"fieldConfig": {
"defaults": {
"color": {
"mode": "thresholds"
},
"mappings": [
{
"options": {
"match": "null",
"result": {
"text": "N/A"
}
},
"type": "special"
}
],
"thresholds": {
"mode": "absolute",
"steps": [
{
"color": "#299c46"
},
{
"color": "rgba(237, 129, 40, 0.89)",
"value": 2
},
{
"color": "#d44a3a"
}
]
},
"unit": "none"
},
"overrides": []
},
"gridPos": {
"h": 4,
"w": 3,
"x": 6,
"y": 0
},
"id": 38,
"maxDataPoints": 100,
"options": {
"colorMode": "value",
"graphMode": "none",
"justifyMode": "auto",
"orientation": "horizontal",
"percentChangeColorMode": "standard",
"reduceOptions": {
"calcs": [
"lastNotNull"
],
"fields": "",
"values": false
},
"showPercentChange": false,
"textMode": "auto",
"wideLayout": true
},
"pluginVersion": "12.0.2",
"targets": [
{
"datasource": "${DS_PROMETHEUS}",
"expr": "sum(irate(kafka_controller_controllerstats_uncleanleaderelections_total{namespace=\"$kubernetes_namespace\",strimzi_io_cluster=\"$strimzi_cluster_name\"}[5m]))",
"format": "time_series",
"hide": false,
"intervalFactor": 1,
"refId": "A"
}
],
"title": "비정상 리더 선출 비율",
"type": "stat"
},
{
"datasource": "${DS_PROMETHEUS}",
"description": "Replicas that are online",
"fieldConfig": {
"defaults": {
"color": {
"mode": "thresholds"
},
"mappings": [
{
"options": {
"match": "null",
"result": {
"text": "N/A"
}
},
"type": "special"
}
],
"thresholds": {
"mode": "absolute",
"steps": [
{
"color": "#d44a3a"
},
{
"color": "rgba(237, 129, 40, 0.89)",
"value": 0
},
{
"color": "#299c46",
"value": 0
}
]
},
"unit": "none"
},
"overrides": []
},
"gridPos": {
"h": 4,
"w": 3,
"x": 9,
"y": 0
},
"id": 40,
"maxDataPoints": 100,
"options": {
"colorMode": "value",
"graphMode": "none",
"justifyMode": "auto",
"orientation": "horizontal",
"percentChangeColorMode": "standard",
"reduceOptions": {
"calcs": [
"lastNotNull"
],
"fields": "",
"values": false
},
"showPercentChange": false,
"textMode": "auto",
"wideLayout": true
},
"pluginVersion": "12.0.2",
"targets": [
{
"datasource": "${DS_PROMETHEUS}",
"expr": "sum(kafka_server_replicamanager_partitioncount{namespace=\"$kubernetes_namespace\",strimzi_io_cluster=\"$strimzi_cluster_name\"})",
"format": "time_series",
"intervalFactor": 1,
"refId": "A"
}
],
"title": "Online Replicas",
"type": "stat"
},
{
"datasource": "${DS_PROMETHEUS}",
"description": "Number of under-replicated partitions (| ISR | < | all replicas |).",
"fieldConfig": {
"defaults": {
"color": {
"mode": "thresholds"
},
"mappings": [
{
"options": {
"match": "null",
"result": {
"text": "N/A"
}
},
"type": "special"
}
],
"thresholds": {
"mode": "absolute",
"steps": [
{
"color": "#508642"
},
{
"color": "rgba(237, 129, 40, 0.89)",
"value": 1
},
{
"color": "#bf1b00",
"value": 5
}
]
},
"unit": "none"
},
"overrides": []
},
"gridPos": {
"h": 4,
"w": 3,
"x": 12,
"y": 0
},
"id": 30,
"maxDataPoints": 100,
"options": {
"colorMode": "value",
"graphMode": "none",
"justifyMode": "auto",
"orientation": "horizontal",
"percentChangeColorMode": "standard",
"reduceOptions": {
"calcs": [
"lastNotNull"
],
"fields": "",
"values": false
},
"showPercentChange": false,
"textMode": "auto",
"wideLayout": true
},
"pluginVersion": "12.0.2",
"targets": [
{
"datasource": "${DS_PROMETHEUS}",
"expr": "sum(kafka_server_replicamanager_underreplicatedpartitions{namespace=\"$kubernetes_namespace\",strimzi_io_cluster=\"$strimzi_cluster_name\"})",
"format": "time_series",
"hide": false,
"intervalFactor": 2,
"refId": "A"
}
],
"title": "Under Replicated Partitions",
"type": "stat"
},
{
"datasource": "${DS_PROMETHEUS}",
"description": "ISR = 현재 리더와 데이터가 동일한 팔로워 목록\n최소 ISR 설정으로 된 파티션이 n개 있음을 보여주는 패널",
"fieldConfig": {
"defaults": {
"color": {
"mode": "thresholds"
},
"mappings": [
{
"options": {
"match": "null",
"result": {
"color": "#508642",
"text": "0"
}
},
"type": "special"
}
],
"thresholds": {
"mode": "absolute",
"steps": [
{
"color": "#508642"
},
{
"color": "#ef843c",
"value": 1
},
{
"color": "#bf1b00",
"value": 5
}
]
},
"unit": "none"
},
"overrides": []
},
"gridPos": {
"h": 4,
"w": 3,
"x": 15,
"y": 0
},
"id": 102,
"maxDataPoints": 100,
"options": {
"colorMode": "value",
"graphMode": "none",
"justifyMode": "auto",
"orientation": "horizontal",
"percentChangeColorMode": "standard",
"reduceOptions": {
"calcs": [
"lastNotNull"
],
"fields": "",
"values": false
},
"showPercentChange": false,
"textMode": "auto",
"wideLayout": true
},
"pluginVersion": "12.0.2",
"targets": [
{
"datasource": "${DS_PROMETHEUS}",
"expr": "sum(kafka_cluster_partition_atminisr{namespace=\"$kubernetes_namespace\",strimzi_io_cluster=\"$strimzi_cluster_name\"})",
"format": "time_series",
"hide": false,
"intervalFactor": 2,
"refId": "A"
}
],
"title": "Partitions at minimum ISR",
"type": "stat"
},
{
"datasource": "${DS_PROMETHEUS}",
"description": "Number of partitions which are under their minimum in sync replica count (| ISR | < | min.insync.replicas |)",
"fieldConfig": {
"defaults": {
"color": {
"mode": "thresholds"
},
"mappings": [
{
"options": {
"match": "null",
"result": {
"color": "#508642",
"text": "0"
}
},
"type": "special"
}
],
"thresholds": {
"mode": "absolute",
"steps": [
{
"color": "#508642"
},
{
"color": "#ef843c",
"value": 1
},
{
"color": "#bf1b00",
"value": 1
}
]
},
"unit": "none"
},
"overrides": []
},
"gridPos": {
"h": 4,
"w": 3,
"x": 18,
"y": 0
},
"id": 103,
"maxDataPoints": 100,
"options": {
"colorMode": "value",
"graphMode": "none",
"justifyMode": "auto",
"orientation": "horizontal",
"percentChangeColorMode": "standard",
"reduceOptions": {
"calcs": [
"lastNotNull"
],
"fields": "",
"values": false
},
"showPercentChange": false,
"textMode": "auto",
"wideLayout": true
},
"pluginVersion": "12.0.2",
"targets": [
{
"datasource": "${DS_PROMETHEUS}",
"expr": "sum(kafka_cluster_partition_underminisr{namespace=\"$kubernetes_namespace\",strimzi_io_cluster=\"$strimzi_cluster_name\"})",
"format": "time_series",
"hide": false,
"intervalFactor": 2,
"refId": "A"
}
],
"title": "Partitions under minimum ISR",
"type": "stat"
},
{
"datasource": "${DS_PROMETHEUS}",
"description": "Number of partitions that don’t have an active leader and are hence not writable or readable",
"fieldConfig": {
"defaults": {
"color": {
"mode": "thresholds"
},
"mappings": [
{
"options": {
"match": "null",
"result": {
"text": "N/A"
}
},
"type": "special"
}
],
"thresholds": {
"mode": "absolute",
"steps": [
{
"color": "#508642"
},
{
"color": "#ef843c",
"value": 1
},
{
"color": "#bf1b00",
"value": 1
}
]
},
"unit": "none"
},
"overrides": []
},
"gridPos": {
"h": 4,
"w": 3,
"x": 21,
"y": 0
},
"id": 32,
"maxDataPoints": 100,
"options": {
"colorMode": "value",
"graphMode": "none",
"justifyMode": "auto",
"orientation": "horizontal",
"percentChangeColorMode": "standard",
"reduceOptions": {
"calcs": [
"lastNotNull"
],
"fields": "",
"values": false
},
"showPercentChange": false,
"textMode": "auto",
"wideLayout": true
},
"pluginVersion": "12.0.2",
"targets": [
{
"datasource": "${DS_PROMETHEUS}",
"expr": "sum(kafka_controller_kafkacontroller_offlinepartitionscount{namespace=\"$kubernetes_namespace\",strimzi_io_cluster=\"$strimzi_cluster_name\"})",
"format": "time_series",
"hide": false,
"intervalFactor": 1,
"refId": "A"
}
],
"title": "Offline Partitions Count",
"type": "stat"
},
{
"collapsed": false,
"gridPos": {
"h": 1,
"w": 24,
"x": 0,
"y": 4
},
"id": 28,
"panels": [],
"title": "Kafka",
"type": "row"
},
{
"datasource": "${DS_PROMETHEUS}",
"description": "Aggregated Kafka broker pods CPU usage",
"fieldConfig": {
"defaults": {
"color": {
"mode": "palette-classic"
},
"custom": {
"axisBorderShow": false,
"axisCenteredZero": false,
"axisColorMode": "text",
"axisLabel": "",
"axisPlacement": "auto",
"barAlignment": 0,
"barWidthFactor": 0.6,
"drawStyle": "line",
"fillOpacity": 10,
"gradientMode": "none",
"hideFrom": {
"legend": false,
"tooltip": false,
"viz": false
},
"insertNulls": false,
"lineInterpolation": "linear",
"lineWidth": 1,
"pointSize": 5,
"scaleDistribution": {
"type": "linear"
},
"showPoints": "never",
"spanNulls": false,
"stacking": {
"group": "A",
"mode": "none"
},
"thresholdsStyle": {
"mode": "off"
}
},
"mappings": [],
"thresholds": {
"mode": "absolute",
"steps": [
{
"color": "green"
},
{
"color": "red",
"value": 80
}
]
},
"unit": "short"
},
"overrides": []
},
"gridPos": {
"h": 7,
"w": 6,
"x": 0,
"y": 5
},
"id": 81,
"options": {
"legend": {
"calcs": [],
"displayMode": "list",
"placement": "bottom",
"showLegend": true
},
"tooltip": {
"hideZeros": false,
"mode": "multi",
"sort": "none"
}
},
"pluginVersion": "12.0.2",
"targets": [
{
"datasource": "${DS_PROMETHEUS}",
"editorMode": "code",
"expr": "sum by (pod) (\n rate(container_cpu_usage_seconds_total{\n namespace=\"kafka-operator\",\n pod=~\"(kafka-cluster-broker-.*|kafka-cluster-controller-2)\",\n container!=\"\"\n }[5m])\n)",
"format": "time_series",
"hide": false,
"intervalFactor": 1,
"legendFormat": "{{pod}}",
"range": true,
"refId": "A"
}
],
"title": "CPU Usage",
"type": "timeseries"
},
{
"datasource": "${DS_PROMETHEUS}",
"description": "Kafka broker pods memory usage",
"fieldConfig": {
"defaults": {
"color": {
"mode": "palette-classic"
},
"custom": {
"axisBorderShow": false,
"axisCenteredZero": false,
"axisColorMode": "text",
"axisLabel": "",
"axisPlacement": "auto",
"barAlignment": 0,
"barWidthFactor": 0.6,
"drawStyle": "line",
"fillOpacity": 10,
"gradientMode": "none",
"hideFrom": {
"legend": false,
"tooltip": false,
"viz": false
},
"insertNulls": false,
"lineInterpolation": "linear",
"lineWidth": 1,
"pointSize": 5,
"scaleDistribution": {
"type": "linear"
},
"showPoints": "never",
"spanNulls": false,
"stacking": {
"group": "A",
"mode": "none"
},
"thresholdsStyle": {
"mode": "off"
}
},
"mappings": [],
"thresholds": {
"mode": "absolute",
"steps": [
{
"color": "green"
},
{
"color": "red",
"value": 80
}
]
},
"unit": "bytes"
},
"overrides": []
},
"gridPos": {
"h": 7,
"w": 6,
"x": 6,
"y": 5
},
"id": 109,
"options": {
"legend": {
"calcs": [],
"displayMode": "list",
"placement": "bottom",
"showLegend": true
},
"tooltip": {
"hideZeros": false,
"mode": "multi",
"sort": "none"
}
},
"pluginVersion": "12.0.2",
"targets": [
{
"datasource": "${DS_PROMETHEUS}",
"editorMode": "code",
"expr": "sum by (pod) (\n container_memory_working_set_bytes{\n namespace=\"kafka-operator\",\n pod=~\"(kafka-cluster-broker-.*|kafka-cluster-controller-.*)\",\n container!=\"\"\n }\n)",
"format": "time_series",
"hide": false,
"intervalFactor": 1,
"legendFormat": "{{pod}}",
"range": true,
"refId": "A"
}
],
"title": "Memory Usage",
"type": "timeseries"
},
{
"datasource": "${DS_PROMETHEUS}",
"description": "Kafka broker pods disk usage",
"fieldConfig": {
"defaults": {
"color": {
"mode": "palette-classic"
},
"custom": {
"axisBorderShow": false,
"axisCenteredZero": false,
"axisColorMode": "text",
"axisLabel": "",
"axisPlacement": "auto",
"barAlignment": 0,
"barWidthFactor": 0.6,
"drawStyle": "line",
"fillOpacity": 10,
"gradientMode": "none",
"hideFrom": {
"legend": false,
"tooltip": false,
"viz": false
},
"insertNulls": false,
"lineInterpolation": "linear",
"lineWidth": 1,
"pointSize": 5,
"scaleDistribution": {
"type": "linear"
},
"showPoints": "never",
"spanNulls": false,
"stacking": {
"group": "A",
"mode": "none"
},
"thresholdsStyle": {
"mode": "off"
}
},
"mappings": [],
"thresholds": {
"mode": "absolute",
"steps": [
{
"color": "green"
},
{
"color": "red",
"value": 80
}
]
},
"unit": "bytes"
},
"overrides": []
},
"gridPos": {
"h": 7,
"w": 6,
"x": 12,
"y": 5
},
"id": 83,
"options": {
"legend": {
"calcs": [],
"displayMode": "list",
"placement": "bottom",
"showLegend": true
},
"tooltip": {
"hideZeros": false,
"mode": "multi",
"sort": "none"
}
},
"pluginVersion": "12.0.2",
"targets": [
{
"datasource": "${DS_PROMETHEUS}",
"editorMode": "code",
"expr": "100 *\nsum by (namespace, persistentvolumeclaim) (\n kubelet_volume_stats_used_bytes{namespace=\"kafka-operator\", persistentvolumeclaim=\"data-0-kafka-cluster-broker-0\"}\n)\n/\nsum by (namespace, persistentvolumeclaim) (\n kubelet_volume_stats_capacity_bytes{namespace=\"kafka-operator\", persistentvolumeclaim=\"data-0-kafka-cluster-broker-0\"}\n)",
"format": "time_series",
"hide": false,
"intervalFactor": 1,
"legendFormat": "{{persistentvolumeclaim}}",
"range": true,
"refId": "A"
},
{
"datasource": {
"type": "prometheus",
"uid": "${DS_PROMETHEUS}"
},
"editorMode": "code",
"expr": "100 *\nsum by (namespace, persistentvolumeclaim) (\n kubelet_volume_stats_used_bytes{namespace=\"kafka-operator\", persistentvolumeclaim=\"data-0-kafka-cluster-broker-1\"}\n)\n/\nsum by (namespace, persistentvolumeclaim) (\n kubelet_volume_stats_capacity_bytes{namespace=\"kafka-operator\", persistentvolumeclaim=\"data-0-kafka-cluster-broker-1\"}\n)",
"hide": false,
"instant": false,
"legendFormat": "{{persistentvolumeclaim}}",
"range": true,
"refId": "B"
},
{
"datasource": {
"type": "prometheus",
"uid": "${DS_PROMETHEUS}"
},
"editorMode": "code",
"expr": "100 *\nsum by (namespace, persistentvolumeclaim) (\n kubelet_volume_stats_used_bytes{namespace=\"kafka-operator\", persistentvolumeclaim=\"data-0-kafka-cluster-broker-2\"}\n)\n/\nsum by (namespace, persistentvolumeclaim) (\n kubelet_volume_stats_capacity_bytes{namespace=\"kafka-operator\", persistentvolumeclaim=\"data-0-kafka-cluster-broker-2\"}\n)",
"hide": false,
"instant": false,
"legendFormat": "{{persistentvolumeclaim}}",
"range": true,
"refId": "C"
},
{
"datasource": {
"type": "prometheus",
"uid": "${DS_PROMETHEUS}"
},
"editorMode": "code",
"expr": "100 *\nsum by (namespace, persistentvolumeclaim) (\n kubelet_volume_stats_used_bytes{namespace=\"kafka-operator\", persistentvolumeclaim=\"data-0-kafka-cluster-controller-3\"}\n)\n/\nsum by (namespace, persistentvolumeclaim) (\n kubelet_volume_stats_capacity_bytes{namespace=\"kafka-operator\",persistentvolumeclaim=\"data-0-kafka-cluster-controller-3\"}\n)",
"hide": false,
"instant": false,
"legendFormat": "{{persistentvolumeclaim}}",
"range": true,
"refId": "D"
},
{
"datasource": {
"type": "prometheus",
"uid": "${DS_PROMETHEUS}"
},
"editorMode": "code",
"expr": "100 *\nsum by (namespace, persistentvolumeclaim) (\n kubelet_volume_stats_used_bytes{namespace=\"kafka-operator\", persistentvolumeclaim=\"data-0-kafka-cluster-controller-4\"}\n)\n/\nsum by (namespace, persistentvolumeclaim) (\n kubelet_volume_stats_capacity_bytes{namespace=\"kafka-operator\",persistentvolumeclaim=\"data-0-kafka-cluster-controller-4\"}\n)",
"hide": false,
"instant": false,
"legendFormat": "{{persistentvolumeclaim}}",
"range": true,
"refId": "E"
},
{
"datasource": {
"type": "prometheus",
"uid": "${DS_PROMETHEUS}"
},
"editorMode": "code",
"expr": "100 *\nsum by (namespace, persistentvolumeclaim) (\n kubelet_volume_stats_used_bytes{namespace=\"kafka-operator\", persistentvolumeclaim=\"data-0-kafka-cluster-controller-5\"}\n)\n/\nsum by (namespace, persistentvolumeclaim) (\n kubelet_volume_stats_capacity_bytes{namespace=\"kafka-operator\",persistentvolumeclaim=\"data-0-kafka-cluster-controller-5\"}\n)",
"hide": false,
"instant": false,
"legendFormat": "{{persistentvolumeclaim}}",
"range": true,
"refId": "F"
}
],
"title": "현재 사용 중인 디스크 사용량",
"type": "timeseries"
},
{
"datasource": "${DS_PROMETHEUS}",
"description": "이 패널은 Kafka 브로커가 현재 열고 있는 파일과 네트워크 연결의 개수를 보여줍니다.\nKafka는 토픽의 로그 파일, 프로듀서/컨슈머와의 연결, 내부 통신 등을 위해 많은 파일과 소켓을 동시에 열어둡니다.\n이 값을 통해 브로커가 리소스를 정상적으로 사용 중인지, 또는 파일 디스크립터 한도에 가까워지고 있는지를 모니터링할 수 있습니다.",
"fieldConfig": {
"defaults": {
"color": {
"mode": "palette-classic"
},
"custom": {
"axisBorderShow": false,
"axisCenteredZero": false,
"axisColorMode": "text",
"axisLabel": "",
"axisPlacement": "auto",
"barAlignment": 0,
"barWidthFactor": 0.6,
"drawStyle": "line",
"fillOpacity": 10,
"gradientMode": "none",
"hideFrom": {
"legend": false,
"tooltip": false,
"viz": false
},
"insertNulls": false,
"lineInterpolation": "linear",
"lineWidth": 1,
"pointSize": 5,
"scaleDistribution": {
"type": "linear"
},
"showPoints": "never",
"spanNulls": false,
"stacking": {
"group": "A",
"mode": "none"
},
"thresholdsStyle": {
"mode": "off"
}
},
"mappings": [],
"thresholds": {
"mode": "absolute",
"steps": [
{
"color": "green"
},
{
"color": "red",
"value": 80
}
]
},
"unit": "none"
},
"overrides": []
},
"gridPos": {
"h": 7,
"w": 6,
"x": 18,
"y": 5
},
"id": 107,
"options": {
"legend": {
"calcs": [],
"displayMode": "list",
"placement": "bottom",
"showLegend": true
},
"tooltip": {
"hideZeros": false,
"mode": "multi",
"sort": "none"
}
},
"pluginVersion": "12.0.2",
"targets": [
{
"datasource": {
"type": "prometheus",
"uid": "${DS_PROMETHEUS}"
},
"editorMode": "code",
"expr": "sum by (pod) (\n process_open_fds{namespace=\"kafka-operator\"}\n)",
"hide": false,
"instant": false,
"legendFormat": "__auto",
"range": true,
"refId": "B"
}
],
"title": "브로커, 컨트롤러가 열고 있는 파일의 개수",
"type": "timeseries"
},
{
"datasource": {
"type": "prometheus",
"uid": "prometheus"
},
"fieldConfig": {
"defaults": {
"color": {
"mode": "palette-classic"
},
"custom": {
"axisBorderShow": false,
"axisCenteredZero": false,
"axisColorMode": "text",
"axisLabel": "",
"axisPlacement": "auto",
"barAlignment": 0,
"barWidthFactor": 0.6,
"drawStyle": "line",
"fillOpacity": 10,
"gradientMode": "none",
"hideFrom": {
"legend": false,
"tooltip": false,
"viz": false
},
"insertNulls": false,
"lineInterpolation": "linear",
"lineWidth": 1,
"pointSize": 5,
"scaleDistribution": {
"type": "linear"
},
"showPoints": "never",
"spanNulls": false,
"stacking": {
"group": "A",
"mode": "none"
},
"thresholdsStyle": {
"mode": "off"
}
},
"mappings": [],
"thresholds": {
"mode": "absolute",
"steps": [
{
"color": "green"
},
{
"color": "red",
"value": 80
}
]
},
"unit": "decbytes"
},
"overrides": []
},
"gridPos": {
"h": 7,
"w": 6,
"x": 0,
"y": 12
},
"id": 93,
"options": {
"legend": {
"calcs": [],
"displayMode": "list",
"placement": "bottom",
"showLegend": true
},
"tooltip": {
"hideZeros": false,
"mode": "multi",
"sort": "none"
}
},
"pluginVersion": "12.0.2",
"targets": [
{
"datasource": {
"type": "prometheus",
"uid": "prometheus"
},
"editorMode": "code",
"expr": "sum by (pod) (\n jvm_memory_bytes_heap_used{namespace=\"kafka-operator\"}\n)",
"format": "time_series",
"intervalFactor": 1,
"legendFormat": "{{kubernetes_pod_name}}",
"range": true,
"refId": "A"
}
],
"title": "JVM Memory Used",
"type": "timeseries"
},
{
"datasource": "${DS_PROMETHEUS}",
"fieldConfig": {
"defaults": {
"color": {
"mode": "palette-classic"
},
"custom": {
"axisBorderShow": false,
"axisCenteredZero": false,
"axisColorMode": "text",
"axisLabel": "",
"axisPlacement": "auto",
"barAlignment": 0,
"barWidthFactor": 0.6,
"drawStyle": "line",
"fillOpacity": 10,
"gradientMode": "none",
"hideFrom": {
"legend": false,
"tooltip": false,
"viz": false
},
"insertNulls": false,
"lineInterpolation": "linear",
"lineWidth": 1,
"pointSize": 5,
"scaleDistribution": {
"type": "linear"
},
"showPoints": "never",
"spanNulls": false,
"stacking": {
"group": "A",
"mode": "none"
},
"thresholdsStyle": {
"mode": "off"
}
},
"mappings": [],
"thresholds": {
"mode": "absolute",
"steps": [
{
"color": "green"
},
{
"color": "red",
"value": 80
}
]
},
"unit": "ms"
},
"overrides": []
},
"gridPos": {
"h": 7,
"w": 6,
"x": 6,
"y": 12
},
"id": 95,
"options": {
"legend": {
"calcs": [],
"displayMode": "list",
"placement": "bottom",
"showLegend": true
},
"tooltip": {
"hideZeros": false,
"mode": "multi",
"sort": "none"
}
},
"pluginVersion": "12.0.2",
"targets": [
{
"datasource": "${DS_PROMETHEUS}",
"editorMode": "code",
"expr": "sum by(pod) (\n rate(jvm_gc_collection_seconds_sum{namespace=\"kafka-operator\"}[5m])\n)",
"format": "time_series",
"intervalFactor": 1,
"legendFormat": "{{kubernetes_pod_name}}",
"range": true,
"refId": "A"
}
],
"title": "JVM GC Time",
"type": "timeseries"
},
{
"datasource": "${DS_PROMETHEUS}",
"fieldConfig": {
"defaults": {
"color": {
"mode": "palette-classic"
},
"custom": {
"axisBorderShow": false,
"axisCenteredZero": false,
"axisColorMode": "text",
"axisLabel": "",
"axisPlacement": "auto",
"barAlignment": 0,
"barWidthFactor": 0.6,
"drawStyle": "line",
"fillOpacity": 10,
"gradientMode": "none",
"hideFrom": {
"legend": false,
"tooltip": false,
"viz": false
},
"insertNulls": false,
"lineInterpolation": "linear",
"lineWidth": 1,
"pointSize": 5,
"scaleDistribution": {
"type": "linear"
},
"showPoints": "never",
"spanNulls": false,
"stacking": {
"group": "A",
"mode": "none"
},
"thresholdsStyle": {
"mode": "off"
}
},
"mappings": [],
"thresholds": {
"mode": "absolute",
"steps": [
{
"color": "green"
},
{
"color": "red",
"value": 80
}
]
},
"unit": "short"
},
"overrides": []
},
"gridPos": {
"h": 7,
"w": 6,
"x": 12,
"y": 12
},
"id": 97,
"options": {
"legend": {
"calcs": [],
"displayMode": "list",
"placement": "bottom",
"showLegend": true
},
"tooltip": {
"hideZeros": false,
"mode": "multi",
"sort": "none"
}
},
"pluginVersion": "12.0.2",
"targets": [
{
"datasource": {
"type": "prometheus",
"uid": "${DS_PROMETHEUS}"
},
"editorMode": "code",
"expr": "sum by (pod) (\n rate(jvm_gc_collection_seconds_count{namespace=\"kafka-operator\"}[5m])\n)",
"hide": false,
"instant": false,
"legendFormat": "__auto",
"range": true,
"refId": "B"
}
],
"title": "JVM GC Count",
"type": "timeseries"
},
{
"datasource": "${DS_PROMETHEUS}",
"description": "JVM thread count",
"fieldConfig": {
"defaults": {
"color": {
"mode": "palette-classic"
},
"custom": {
"axisBorderShow": false,
"axisCenteredZero": false,
"axisColorMode": "text",
"axisLabel": "",
"axisPlacement": "auto",
"barAlignment": 0,
"barWidthFactor": 0.6,
"drawStyle": "line",
"fillOpacity": 10,
"gradientMode": "none",
"hideFrom": {
"legend": false,
"tooltip": false,
"viz": false
},
"insertNulls": false,
"lineInterpolation": "linear",
"lineWidth": 1,
"pointSize": 5,
"scaleDistribution": {
"type": "linear"
},
"showPoints": "never",
"spanNulls": false,
"stacking": {
"group": "A",
"mode": "none"
},
"thresholdsStyle": {
"mode": "off"
}
},
"mappings": [],
"thresholds": {
"mode": "absolute",
"steps": [
{
"color": "green"
},
{
"color": "red",
"value": 80
}
]
},
"unit": "short"
},
"overrides": []
},
"gridPos": {
"h": 7,
"w": 6,
"x": 18,
"y": 12
},
"id": 108,
"options": {
"legend": {
"calcs": [],
"displayMode": "list",
"placement": "bottom",
"showLegend": true
},
"tooltip": {
"hideZeros": false,
"mode": "multi",
"sort": "none"
}
},
"pluginVersion": "12.0.2",
"targets": [
{
"datasource": "${DS_PROMETHEUS}",
"disableTextWrap": false,
"editorMode": "builder",
"expr": "sum by(kubernetes_pod_name) (jvm_threads_current{namespace=\"kafka-operator\", pod=~\"kafka-cluster-broker-0\"})",
"format": "time_series",
"fullMetaSearch": false,
"includeNullMetadata": true,
"intervalFactor": 1,
"legendFormat": "{{kubernetes_pod_name}}",
"range": true,
"refId": "A",
"useBackend": false
},
{
"datasource": "${DS_PROMETHEUS}",
"disableTextWrap": false,
"editorMode": "builder",
"expr": "sum by(kubernetes_pod_name) (jvm_threads_current{namespace=\"kafka-operator\", pod=~\"kafka-cluster-broker-1\"})",
"format": "time_series",
"fullMetaSearch": false,
"hide": false,
"includeNullMetadata": true,
"intervalFactor": 1,
"legendFormat": "{{kubernetes_pod_name}}",
"range": true,
"refId": "B",
"useBackend": false
},
{
"datasource": "${DS_PROMETHEUS}",
"disableTextWrap": false,
"editorMode": "builder",
"expr": "sum by(kubernetes_pod_name) (jvm_threads_current{namespace=\"kafka-operator\", pod=~\"kafka-cluster-controller-2\"})",
"format": "time_series",
"fullMetaSearch": false,
"hide": false,
"includeNullMetadata": true,
"intervalFactor": 1,
"legendFormat": "{{kubernetes_pod_name}}",
"range": true,
"refId": "C",
"useBackend": false
}
],
"title": "JVM Thread Count",
"type": "timeseries"
},
{
"datasource": "${DS_PROMETHEUS}",
"description": "Total incoming byte rate",
"fieldConfig": {
"defaults": {
"color": {
"mode": "thresholds"
},
"mappings": [
{
"options": {
"match": "null",
"result": {
"color": "rgba(237, 129, 40, 0.89)",
"text": "0"
}
},
"type": "special"
}
],
"thresholds": {
"mode": "absolute",
"steps": [
{
"color": "#d44a3a"
},
{
"color": "rgba(237, 129, 40, 0.89)",
"value": 0
},
{
"color": "#299c46",
"value": 2
}
]
},
"unit": "Bps"
},
"overrides": []
},
"gridPos": {
"h": 4,
"w": 6,
"x": 0,
"y": 19
},
"id": 98,
"maxDataPoints": 100,
"options": {
"colorMode": "value",
"graphMode": "none",
"justifyMode": "auto",
"orientation": "horizontal",
"percentChangeColorMode": "standard",
"reduceOptions": {
"calcs": [
"lastNotNull"
],
"fields": "",
"values": false
},
"showPercentChange": false,
"textMode": "auto",
"wideLayout": true
},
"pluginVersion": "12.0.2",
"targets": [
{
"datasource": "${DS_PROMETHEUS}",
"expr": "sum(irate(kafka_server_brokertopicmetrics_bytesin_total{namespace=\"$kubernetes_namespace\",strimzi_io_cluster=\"$strimzi_cluster_name\",topic=~\"$kafka_topic\",topic!=\"\",kubernetes_pod_name=~\"$strimzi_cluster_name-$kafka_broker\"}[5m]))",
"format": "time_series",
"hide": false,
"intervalFactor": 1,
"legendFormat": "",
"refId": "A"
}
],
"title": "Total Incoming Byte Rate",
"type": "stat"
},
{
"datasource": "${DS_PROMETHEUS}",
"description": "Total outgoing byte rate",
"fieldConfig": {
"defaults": {
"color": {
"mode": "thresholds"
},
"mappings": [
{
"options": {
"match": "null",
"result": {
"color": "rgba(237, 129, 40, 0.89)",
"text": "0"
}
},
"type": "special"
}
],
"thresholds": {
"mode": "absolute",
"steps": [
{
"color": "#d44a3a"
},
{
"color": "rgba(237, 129, 40, 0.89)",
"value": 0
},
{
"color": "#299c46",
"value": 2
}
]
},
"unit": "Bps"
},
"overrides": []
},
"gridPos": {
"h": 4,
"w": 6,
"x": 6,
"y": 19
},
"id": 99,
"maxDataPoints": 100,
"options": {
"colorMode": "value",
"graphMode": "none",
"justifyMode": "auto",
"orientation": "horizontal",
"percentChangeColorMode": "standard",
"reduceOptions": {
"calcs": [
"lastNotNull"
],
"fields": "",
"values": false
},
"showPercentChange": false,
"textMode": "auto",
"wideLayout": true
},
"pluginVersion": "12.0.2",
"targets": [
{
"datasource": "${DS_PROMETHEUS}",
"expr": "sum(irate(kafka_server_brokertopicmetrics_bytesout_total{namespace=\"$kubernetes_namespace\",strimzi_io_cluster=\"$strimzi_cluster_name\",topic=~\"$kafka_topic\",topic!=\"\",kubernetes_pod_name=~\"$strimzi_cluster_name-$kafka_broker\"}[5m]))",
"format": "time_series",
"hide": false,
"intervalFactor": 1,
"legendFormat": "",
"refId": "A"
}
],
"title": "Total Outgoing Byte Rate",
"type": "stat"
},
{
"datasource": "${DS_PROMETHEUS}",
"description": "Incoming messages rate",
"fieldConfig": {
"defaults": {
"color": {
"mode": "thresholds"
},
"mappings": [
{
"options": {
"match": "null",
"result": {
"color": "rgba(237, 129, 40, 0.89)",
"text": "0"
}
},
"type": "special"
}
],
"thresholds": {
"mode": "absolute",
"steps": [
{
"color": "#d44a3a"
},
{
"color": "rgba(237, 129, 40, 0.89)",
"value": 0
},
{
"color": "#299c46",
"value": 2
}
]
},
"unit": "wps"
},
"overrides": []
},
"gridPos": {
"h": 4,
"w": 6,
"x": 12,
"y": 19
},
"id": 100,
"maxDataPoints": 100,
"options": {
"colorMode": "value",
"graphMode": "none",
"justifyMode": "auto",
"orientation": "horizontal",
"percentChangeColorMode": "standard",
"reduceOptions": {
"calcs": [
"lastNotNull"
],
"fields": "",
"values": false
},
"showPercentChange": false,
"textMode": "auto",
"wideLayout": true
},
"pluginVersion": "12.0.2",
"targets": [
{
"datasource": "${DS_PROMETHEUS}",
"expr": "sum(irate(kafka_server_brokertopicmetrics_messagesin_total{namespace=\"$kubernetes_namespace\",strimzi_io_cluster=\"$strimzi_cluster_name\",topic=~\"$kafka_topic\",topic!=\"\",kubernetes_pod_name=~\"$strimzi_cluster_name-$kafka_broker\"}[5m]))",
"format": "time_series",
"hide": false,
"intervalFactor": 1,
"legendFormat": "",
"refId": "A"
}
],
"title": "Incoming Messages Rate",
"type": "stat"
},
{
"datasource": "${DS_PROMETHEUS}",
"description": "Total produce request rate",
"fieldConfig": {
"defaults": {
"color": {
"mode": "thresholds"
},
"mappings": [
{
"options": {
"match": "null",
"result": {
"color": "rgba(237, 129, 40, 0.89)",
"text": "0"
}
},
"type": "special"
}
],
"thresholds": {
"mode": "absolute",
"steps": [
{
"color": "#d44a3a"
},
{
"color": "rgba(237, 129, 40, 0.89)",
"value": 0
},
{
"color": "#299c46",
"value": 2
}
]
},
"unit": "reqps"
},
"overrides": []
},
"gridPos": {
"h": 4,
"w": 6,
"x": 18,
"y": 19
},
"id": 101,
"maxDataPoints": 100,
"options": {
"colorMode": "value",
"graphMode": "none",
"justifyMode": "auto",
"orientation": "horizontal",
"percentChangeColorMode": "standard",
"reduceOptions": {
"calcs": [
"lastNotNull"
],
"fields": "",
"values": false
},
"showPercentChange": false,
"textMode": "auto",
"wideLayout": true
},
"pluginVersion": "12.0.2",
"targets": [
{
"datasource": "${DS_PROMETHEUS}",
"expr": "sum(irate(kafka_server_brokertopicmetrics_totalproducerequests_total{namespace=\"$kubernetes_namespace\",strimzi_io_cluster=\"$strimzi_cluster_name\",topic=~\"$kafka_topic\",topic!=\"\",kubernetes_pod_name=~\"$strimzi_cluster_name-$kafka_broker\"}[5m]))",
"format": "time_series",
"hide": false,
"intervalFactor": 1,
"legendFormat": "",
"refId": "A"
}
],
"title": "Total Produce Request Rate",
"type": "stat"
},
{
"datasource": "${DS_PROMETHEUS}",
"description": "Kafka 클러스터 전체의 초당 데이터 처리량을 나타냅니다.\n\nIncoming Byte Rate: 프로듀서가 브로커로 전송하는 데이터량 \nOutgoing Byte Rate: 컨슈머가 브로커에서 가져가는 데이터량\n이 패널은 실시간 트래픽 흐름을 시각화하여 전체 Kafka 처리량, 부하 증가, 병목 현상을 빠르게 파악할 수 있습니다.\n",
"fieldConfig": {
"defaults": {
"color": {
"mode": "palette-classic"
},
"custom": {
"axisBorderShow": false,
"axisCenteredZero": false,
"axisColorMode": "text",
"axisLabel": "",
"axisPlacement": "auto",
"barAlignment": 0,
"barWidthFactor": 0.6,
"drawStyle": "line",
"fillOpacity": 10,
"gradientMode": "none",
"hideFrom": {
"legend": false,
"tooltip": false,
"viz": false
},
"insertNulls": false,
"lineInterpolation": "linear",
"lineWidth": 1,
"pointSize": 5,
"scaleDistribution": {
"type": "linear"
},
"showPoints": "never",
"spanNulls": false,
"stacking": {
"group": "A",
"mode": "none"
},
"thresholdsStyle": {
"mode": "off"
}
},
"mappings": [],
"thresholds": {
"mode": "absolute",
"steps": [
{
"color": "green"
},
{
"color": "red",
"value": 80
}
]
},
"unit": "bytes"
},
"overrides": []
},
"gridPos": {
"h": 8,
"w": 12,
"x": 0,
"y": 23
},
"id": 44,
"options": {
"legend": {
"calcs": [],
"displayMode": "list",
"placement": "bottom",
"showLegend": true
},
"tooltip": {
"hideZeros": false,
"mode": "multi",
"sort": "none"
}
},
"pluginVersion": "12.0.2",
"targets": [
{
"datasource": "${DS_PROMETHEUS}",
"editorMode": "code",
"expr": "sum(irate(kafka_server_brokertopicmetrics_bytesin_total{namespace=\"$kubernetes_namespace\",pod=~\"kafka-cluster-broker-.*\"}[5m]))",
"format": "time_series",
"hide": false,
"instant": false,
"interval": "",
"intervalFactor": 1,
"legendFormat": "Total Incoming Byte Rate",
"refId": "A"
},
{
"datasource": "${DS_PROMETHEUS}",
"editorMode": "code",
"expr": "sum(irate(kafka_server_brokertopicmetrics_bytesout_total{namespace=\"$kubernetes_namespace\", pod=~\"kafka-cluster-broker-.*\"}[5m]))",
"format": "time_series",
"hide": false,
"intervalFactor": 1,
"legendFormat": "Total Outgoing Byte Rate",
"range": true,
"refId": "B"
}
],
"title": "Byte Rate (In / Out)",
"type": "timeseries"
},
{
"datasource": "${DS_PROMETHEUS}",
"description": "Kafka 클러스터에 초당 유입되는 전체 메시지 수를 나타냅니다. \n프로듀서가 브로커로 기록하는 메시지 속도를 합산한 값으로,\n트래픽 증가, 부하 추세, ingest 병목 여부를 빠르게 확인할 수 있습니다.",
"fieldConfig": {
"defaults": {
"color": {
"mode": "palette-classic"
},
"custom": {
"axisBorderShow": false,
"axisCenteredZero": false,
"axisColorMode": "text",
"axisLabel": "",
"axisPlacement": "auto",
"barAlignment": 0,
"barWidthFactor": 0.6,
"drawStyle": "line",
"fillOpacity": 10,
"gradientMode": "none",
"hideFrom": {
"legend": false,
"tooltip": false,
"viz": false
},
"insertNulls": false,
"lineInterpolation": "linear",
"lineWidth": 1,
"pointSize": 5,
"scaleDistribution": {
"type": "linear"
},
"showPoints": "never",
"spanNulls": false,
"stacking": {
"group": "A",
"mode": "none"
},
"thresholdsStyle": {
"mode": "off"
}
},
"mappings": [],
"thresholds": {
"mode": "absolute",
"steps": [
{
"color": "green"
},
{
"color": "red",
"value": 80
}
]
},
"unit": "short"
},
"overrides": []
},
"gridPos": {
"h": 8,
"w": 12,
"x": 12,
"y": 23
},
"id": 58,
"options": {
"legend": {
"calcs": [],
"displayMode": "list",
"placement": "bottom",
"showLegend": true
},
"tooltip": {
"hideZeros": false,
"mode": "multi",
"sort": "none"
}
},
"pluginVersion": "12.0.2",
"targets": [
{
"datasource": "${DS_PROMETHEUS}",
"editorMode": "code",
"expr": "sum(irate(kafka_server_brokertopicmetrics_messagesin_total{namespace=\"$kubernetes_namespace\",pod=~\"kafka-cluster-broker-.*\"}[5m]))",
"format": "time_series",
"intervalFactor": 1,
"legendFormat": "Total Incoming Messages Rate",
"range": true,
"refId": "D"
}
],
"title": "Messages In Per Second",
"type": "timeseries"
},
{
"datasource": "${DS_PROMETHEUS}",
"description": "Kafka 브로커가 처리하는 초당 Produce(쓰기) 요청 수를 나타냅니다.\n- Total Produce Request Rate: 프로듀서가 브로커로 전송한 전체 쓰기 요청 수\n- Failed Produce Request Rate: 처리 실패한 쓰기 요청 수\n\n트래픽 증가, 쓰기 병목, 오류율 상승 등을 빠르게 파악하여\n브로커 상태 및 프로듀서 동작 이상을 감지하는 데 활용됩니다.",
"fieldConfig": {
"defaults": {
"color": {
"mode": "palette-classic"
},
"custom": {
"axisBorderShow": false,
"axisCenteredZero": false,
"axisColorMode": "text",
"axisLabel": "",
"axisPlacement": "auto",
"barAlignment": 0,
"barWidthFactor": 0.6,
"drawStyle": "line",
"fillOpacity": 10,
"gradientMode": "none",
"hideFrom": {
"legend": false,
"tooltip": false,
"viz": false
},
"insertNulls": false,
"lineInterpolation": "linear",
"lineWidth": 1,
"pointSize": 5,
"scaleDistribution": {
"type": "linear"
},
"showPoints": "never",
"spanNulls": false,
"stacking": {
"group": "A",
"mode": "none"
},
"thresholdsStyle": {
"mode": "off"
}
},
"mappings": [],
"thresholds": {
"mode": "absolute",
"steps": [
{
"color": "green"
},
{
"color": "red",
"value": 80
}
]
},
"unit": "short"
},
"overrides": []
},
"gridPos": {
"h": 8,
"w": 12,
"x": 0,
"y": 31
},
"id": 50,
"options": {
"legend": {
"calcs": [],
"displayMode": "list",
"placement": "bottom",
"showLegend": true
},
"tooltip": {
"hideZeros": false,
"mode": "multi",
"sort": "none"
}
},
"pluginVersion": "12.0.2",
"targets": [
{
"datasource": "${DS_PROMETHEUS}",
"editorMode": "code",
"expr": "sum(irate(kafka_server_brokertopicmetrics_totalproducerequests_total{namespace=\"$kubernetes_namespace\",pod=~\"kafka-cluster-broker-.*\"}[5m]))",
"format": "time_series",
"intervalFactor": 1,
"legendFormat": "Total Produce Request Rate",
"range": true,
"refId": "A"
},
{
"datasource": "${DS_PROMETHEUS}",
"editorMode": "code",
"expr": "sum(irate(kafka_server_brokertopicmetrics_failedproducerequests_total{namespace=\"$kubernetes_namespace\",pod=~\"kafka-cluster-broker-.*\"}[5m]))",
"format": "time_series",
"hide": false,
"intervalFactor": 1,
"legendFormat": "Failed Produce Request Rate",
"range": true,
"refId": "B"
}
],
"title": "Produce Request Rate",
"type": "timeseries"
},
{
"datasource": "${DS_PROMETHEUS}",
"description": "Kafka 브로커가 초당 처리하는 Fetch(읽기) 요청 수를 나타냅니다.\n- Fetch Request Rate: 전체 컨슈머 읽기 요청량\n- Failed Fetch Request Rate: 실패한 읽기 요청 수\n\n컨슈머 부하, 읽기 병목, 오류율 증가, Lag 가능성 등을 빠르게 파악할 수 있는\nKafka Read Path의 핵심 지표입니다.",
"fieldConfig": {
"defaults": {
"color": {
"mode": "palette-classic"
},
"custom": {
"axisBorderShow": false,
"axisCenteredZero": false,
"axisColorMode": "text",
"axisLabel": "",
"axisPlacement": "auto",
"barAlignment": 0,
"barWidthFactor": 0.6,
"drawStyle": "line",
"fillOpacity": 10,
"gradientMode": "none",
"hideFrom": {
"legend": false,
"tooltip": false,
"viz": false
},
"insertNulls": false,
"lineInterpolation": "linear",
"lineWidth": 1,
"pointSize": 5,
"scaleDistribution": {
"type": "linear"
},
"showPoints": "never",
"spanNulls": false,
"stacking": {
"group": "A",
"mode": "none"
},
"thresholdsStyle": {
"mode": "off"
}
},
"mappings": [],
"thresholds": {
"mode": "absolute",
"steps": [
{
"color": "green"
},
{
"color": "red",
"value": 80
}
]
},
"unit": "short"
},
"overrides": []
},
"gridPos": {
"h": 8,
"w": 12,
"x": 12,
"y": 31
},
"id": 56,
"options": {
"legend": {
"calcs": [],
"displayMode": "list",
"placement": "bottom",
"showLegend": true
},
"tooltip": {
"hideZeros": false,
"mode": "multi",
"sort": "none"
}
},
"pluginVersion": "12.0.2",
"targets": [
{
"datasource": "${DS_PROMETHEUS}",
"editorMode": "code",
"expr": "sum(irate(kafka_server_brokertopicmetrics_totalfetchrequests_total{namespace=\"$kubernetes_namespace\",pod=~\"kafka-cluster-broker-.*\"}[5m]))",
"format": "time_series",
"intervalFactor": 1,
"legendFormat": "Fetch Request Rate",
"range": true,
"refId": "A"
},
{
"datasource": "${DS_PROMETHEUS}",
"editorMode": "code",
"expr": " sum(irate(kafka_server_brokertopicmetrics_failedfetchrequests_total{namespace=\"$kubernetes_namespace\",pod=~\"kafka-cluster-broker-.*\"}[5m]))",
"format": "time_series",
"intervalFactor": 1,
"legendFormat": "Failed Fetch Request Rate",
"range": true,
"refId": "B"
}
],
"title": "Fetch Request Rate",
"type": "timeseries"
},
{
"datasource": "${DS_PROMETHEUS}",
"description": "Kafka 브로커의 Network Processor(Thread)가 얼마나 Idle 상태인지(여유가 있는지)를 나타냅니다.\n \nIdle Percent가 높을수록 네트워크 요청 처리 여유가 많으며,\nIdle Percent가 낮아질수록 Produce/Fetch 요청 증가 또는 네트워크 병목 가능성이 커집니다.\n\n브로커 간 트래픽 불균형, 네트워크 처리 병목, 부하 급증을 파악하는 핵심 지표입니다.\n\nY축 값이 300%로 보이는 이유는 브로커가 3개 이기 때문 입니다.",
"fieldConfig": {
"defaults": {
"color": {
"mode": "palette-classic"
},
"custom": {
"axisBorderShow": false,
"axisCenteredZero": false,
"axisColorMode": "text",
"axisLabel": "",
"axisPlacement": "auto",
"barAlignment": 0,
"barWidthFactor": 0.6,
"drawStyle": "line",
"fillOpacity": 10,
"gradientMode": "none",
"hideFrom": {
"legend": false,
"tooltip": false,
"viz": false
},
"insertNulls": false,
"lineInterpolation": "linear",
"lineWidth": 1,
"pointSize": 5,
"scaleDistribution": {
"type": "linear"
},
"showPoints": "never",
"spanNulls": false,
"stacking": {
"group": "A",
"mode": "none"
},
"thresholdsStyle": {
"mode": "off"
}
},
"mappings": [],
"thresholds": {
"mode": "absolute",
"steps": [
{
"color": "green"
},
{
"color": "red",
"value": 80
}
]
},
"unit": "percent"
},
"overrides": []
},
"gridPos": {
"h": 8,
"w": 12,
"x": 0,
"y": 39
},
"id": 60,
"options": {
"legend": {
"calcs": [],
"displayMode": "list",
"placement": "bottom",
"showLegend": true
},
"tooltip": {
"hideZeros": false,
"mode": "multi",
"sort": "none"
}
},
"pluginVersion": "12.0.2",
"targets": [
{
"datasource": "${DS_PROMETHEUS}",
"editorMode": "code",
"expr": "sum(kafka_network_socketserver_networkprocessoravgidle_percent{namespace=\"$kubernetes_namespace\",pod=~\"kafka-cluster-broker-.*\"}*100) by (kubernetes_pod_name)",
"format": "time_series",
"intervalFactor": 1,
"legendFormat": "{{kubernetes_pod_name}}",
"range": true,
"refId": "A"
}
],
"title": "Network Processor Avg Idle Percent",
"type": "timeseries"
},
{
"datasource": "${DS_PROMETHEUS}",
"description": "Kafka 브로커의 Request Handler 스레드가 Idle 상태로 있었던 비율을 나타냅니다. \n\nIdle Percent가 낮을수록 요청 처리(Produce/Fetch/Metadata 등)가 바쁜 상태이며,\n지속적으로 낮은 값은 브로커 처리 병목, 트래픽 급증, 파티션 불균형 등의 문제를 의미합니다.\n\nKafka 요청 처리 능력을 파악하고 성능 저하를 조기에 감지하는 중요한 지표입니다.\n",
"fieldConfig": {
"defaults": {
"color": {
"mode": "palette-classic"
},
"custom": {
"axisBorderShow": false,
"axisCenteredZero": false,
"axisColorMode": "text",
"axisLabel": "",
"axisPlacement": "auto",
"barAlignment": 0,
"barWidthFactor": 0.6,
"drawStyle": "line",
"fillOpacity": 10,
"gradientMode": "none",
"hideFrom": {
"legend": false,
"tooltip": false,
"viz": false
},
"insertNulls": false,
"lineInterpolation": "linear",
"lineWidth": 1,
"pointSize": 5,
"scaleDistribution": {
"type": "linear"
},
"showPoints": "never",
"spanNulls": false,
"stacking": {
"group": "A",
"mode": "none"
},
"thresholdsStyle": {
"mode": "off"
}
},
"mappings": [],
"thresholds": {
"mode": "absolute",
"steps": [
{
"color": "green"
},
{
"color": "red",
"value": 80
}
]
},
"unit": "percent"
},
"overrides": []
},
"gridPos": {
"h": 8,
"w": 12,
"x": 12,
"y": 39
},
"id": 62,
"options": {
"legend": {
"calcs": [],
"displayMode": "list",
"placement": "bottom",
"showLegend": true
},
"tooltip": {
"hideZeros": false,
"mode": "multi",
"sort": "none"
}
},
"pluginVersion": "12.0.2",
"targets": [
{
"datasource": "${DS_PROMETHEUS}",
"editorMode": "code",
"expr": "sum(kafka_server_kafkarequesthandlerpool_requesthandleravgidle_percent{namespace=\"$kubernetes_namespace\",pod=~\"kafka-cluster-broker-.*\"}*100) by (kubernetes_pod_name)",
"format": "time_series",
"hide": false,
"intervalFactor": 1,
"legendFormat": "{{kubernetes_pod_name}}",
"range": true,
"refId": "A"
}
],
"title": "Request Handler Avg Idle Percent",
"type": "timeseries"
},
{
"datasource": "${DS_PROMETHEUS}",
"description": "Kafka 브로커가 초당 디스크에 기록하는 데이터량(Byte/s)을 나타냅니다. \n프로듀서 메시지 저장, 리플리케이션(sync), 세그먼트 플러시 등 디스크 기반 로그 처리 과정에서 발생하는 모든 write I/O를 반영합니다.\n\n디스크 부하, 파티션 리더 불균형, 트래픽 급증, I/O 병목 여부를 파악하는 데 중요한 지표입니다.",
"fieldConfig": {
"defaults": {
"color": {
"mode": "palette-classic"
},
"custom": {
"axisBorderShow": false,
"axisCenteredZero": false,
"axisColorMode": "text",
"axisLabel": "",
"axisPlacement": "auto",
"barAlignment": 0,
"barWidthFactor": 0.6,
"drawStyle": "line",
"fillOpacity": 10,
"gradientMode": "none",
"hideFrom": {
"legend": false,
"tooltip": false,
"viz": false
},
"insertNulls": false,
"lineInterpolation": "linear",
"lineWidth": 1,
"pointSize": 5,
"scaleDistribution": {
"type": "linear"
},
"showPoints": "never",
"spanNulls": false,
"stacking": {
"group": "A",
"mode": "none"
},
"thresholdsStyle": {
"mode": "off"
}
},
"mappings": [],
"thresholds": {
"mode": "absolute",
"steps": [
{
"color": "green"
},
{
"color": "red",
"value": 80
}
]
},
"unit": "bytes"
},
"overrides": []
},
"gridPos": {
"h": 8,
"w": 12,
"x": 0,
"y": 47
},
"id": 104,
"options": {
"legend": {
"calcs": [],
"displayMode": "list",
"placement": "bottom",
"showLegend": true
},
"tooltip": {
"hideZeros": false,
"mode": "multi",
"sort": "none"
}
},
"pluginVersion": "12.0.2",
"targets": [
{
"datasource": "${DS_PROMETHEUS}",
"editorMode": "code",
"expr": "sum(irate(kafka_server_kafkaserver_linux_disk_write_bytes{namespace=\"$kubernetes_namespace\",pod=~\"kafka-cluster-broker-.*\"}[5m])) by (kubernetes_pod_name)",
"format": "time_series",
"hide": false,
"intervalFactor": 1,
"legendFormat": "{{kubernetes_pod_name}}",
"range": true,
"refId": "A"
}
],
"title": "Disk Writes",
"type": "timeseries"
},
{
"datasource": "${DS_PROMETHEUS}",
"description": "Kafka 브로커가 초당 디스크에서 읽는 데이터량(Byte/s)을 나타냅니다. \n컨슈머 Fetch 요청, 리더-팔로워 복제, 캐시 미스 등으로 발생한 실제 디스크 읽기 IO를 반영합니다.\n\n디스크 병목, 컨슈머 부하, 리더 파티션 불균형, EBS 성능 한계 여부 등을 진단하는 중요한 지표입니다.\n",
"fieldConfig": {
"defaults": {
"color": {
"mode": "palette-classic"
},
"custom": {
"axisBorderShow": false,
"axisCenteredZero": false,
"axisColorMode": "text",
"axisLabel": "",
"axisPlacement": "auto",
"barAlignment": 0,
"barWidthFactor": 0.6,
"drawStyle": "line",
"fillOpacity": 10,
"gradientMode": "none",
"hideFrom": {
"legend": false,
"tooltip": false,
"viz": false
},
"insertNulls": false,
"lineInterpolation": "linear",
"lineWidth": 1,
"pointSize": 5,
"scaleDistribution": {
"type": "linear"
},
"showPoints": "never",
"spanNulls": false,
"stacking": {
"group": "A",
"mode": "none"
},
"thresholdsStyle": {
"mode": "off"
}
},
"mappings": [],
"thresholds": {
"mode": "absolute",
"steps": [
{
"color": "green"
},
{
"color": "red",
"value": 80
}
]
},
"unit": "bytes"
},
"overrides": []
},
"gridPos": {
"h": 8,
"w": 12,
"x": 12,
"y": 47
},
"id": 105,
"options": {
"legend": {
"calcs": [],
"displayMode": "list",
"placement": "bottom",
"showLegend": true
},
"tooltip": {
"hideZeros": false,
"mode": "multi",
"sort": "none"
}
},
"pluginVersion": "12.0.2",
"targets": [
{
"datasource": "${DS_PROMETHEUS}",
"editorMode": "code",
"expr": "sum(irate(kafka_server_kafkaserver_linux_disk_read_bytes{namespace=\"$kubernetes_namespace\",pod=~\"kafka-cluster-broker-.*\"}[5m])) by (kubernetes_pod_name)",
"format": "time_series",
"hide": false,
"intervalFactor": 1,
"legendFormat": "{{kubernetes_pod_name}}",
"range": true,
"refId": "A"
}
],
"title": "Disk Reads",
"type": "timeseries"
},
{
"datasource": "${DS_PROMETHEUS}",
"description": "Kafka 브로커의 각 Listener(PLAINTEXT, TLS, REPLICATION 등)에 대해 활성 상태의 네트워크 연결 수를 나타냅니다. \nlistener별 connection 분포를 통해 트래픽 집중 여부, 브로커 부하 불균형,\n복제 트래픽 증가, 애플리케이션 연결 이상 등을 실시간으로 파악할 수 있습니다.\n",
"fieldConfig": {
"defaults": {
"color": {
"mode": "continuous-GrYlRd"
},
"mappings": [],
"thresholds": {
"mode": "absolute",
"steps": [
{
"color": "green"
},
{
"color": "red",
"value": 80
}
]
}
},
"overrides": []
},
"gridPos": {
"h": 8,
"w": 12,
"x": 0,
"y": 55
},
"id": 106,
"options": {
"displayMode": "lcd",
"legend": {
"calcs": [],
"displayMode": "list",
"placement": "bottom",
"showLegend": false
},
"maxVizHeight": 300,
"minVizHeight": 16,
"minVizWidth": 8,
"namePlacement": "auto",
"orientation": "auto",
"reduceOptions": {
"calcs": [
"lastNotNull"
],
"fields": "",
"values": false
},
"showUnfilled": true,
"sizing": "auto",
"valueMode": "color"
},
"pluginVersion": "12.0.2",
"targets": [
{
"datasource": "${DS_PROMETHEUS}",
"editorMode": "code",
"expr": "sum(kafka_server_socket_server_metrics_connection_count{namespace=\"$kubernetes_namespace\",pod=~\"kafka-cluster-broker-.*\"}) by (pod, listener)",
"format": "time_series",
"hide": false,
"intervalFactor": 1,
"legendFormat": "{{listener}}-{{kubernetes_pod_name}}",
"range": true,
"refId": "A"
}
],
"title": "Connection Count per Listener",
"type": "bargauge"
},
{
"datasource": "${DS_PROMETHEUS}",
"description": "각 파티션은 브로커별(replica 단위)로 노출되므로 동일한 파티션 번호가 여러 행으로 나타날 수 있습니다.\n리더/팔로워 구분 없이, 실제 브로커가 보유한 로그 파일 크기를 그대로 확인하는 용도의 패널입니다.",
"fieldConfig": {
"defaults": {
"custom": {
"align": "auto",
"cellOptions": {
"type": "auto"
},
"filterable": true,
"inspect": false
},
"mappings": [],
"thresholds": {
"mode": "absolute",
"steps": [
{
"color": "green"
}
]
}
},
"overrides": [
{
"matcher": {
"id": "byName",
"options": "Log Size"
},
"properties": [
{
"id": "unit",
"value": "decbytes"
}
]
}
]
},
"gridPos": {
"h": 8,
"w": 12,
"x": 12,
"y": 55
},
"id": 91,
"options": {
"cellHeight": "sm",
"footer": {
"countRows": false,
"fields": "",
"reducer": [
"sum"
],
"show": false
},
"frameIndex": 0,
"showHeader": true,
"sortBy": [
{
"desc": true,
"displayName": "Log Size"
}
]
},
"pluginVersion": "12.0.2",
"targets": [
{
"editorMode": "code",
"expr": "kafka_log_log_size{namespace=\"$kubernetes_namespace\", pod=~\"kafka-cluster-broker-.*\",topic=\"ai-result\"}\n",
"format": "table",
"instant": true,
"interval": "",
"intervalFactor": 1,
"legendFormat": "{{topic}}:{{partition}}",
"refId": "A"
}
],
"title": "Log Size",
"transformations": [
{
"id": "organize",
"options": {
"excludeByName": {
"Time": true,
"__name__": true,
"container": true,
"endpoint": true,
"instance": true,
"job": true,
"kubernetes_pod_name": true,
"namespace": true,
"node_ip": true,
"node_name": true,
"pod": true,
"strimzi_io_broker_role": true,
"strimzi_io_cluster": true,
"strimzi_io_component_type": true,
"strimzi_io_controller": true,
"strimzi_io_controller_name": true,
"strimzi_io_controller_role": true,
"strimzi_io_kind": true,
"strimzi_io_name": true,
"strimzi_io_pod_name": true,
"strimzi_io_pool_name": true
},
"indexByName": {
"Time": 0,
"Value": 23,
"__name__": 1,
"container": 3,
"endpoint": 4,
"instance": 5,
"job": 6,
"kubernetes_pod_name": 7,
"namespace": 8,
"node_ip": 9,
"node_name": 10,
"partition": 11,
"pod": 12,
"strimzi_io_broker_role": 13,
"strimzi_io_cluster": 14,
"strimzi_io_component_type": 15,
"strimzi_io_controller": 16,
"strimzi_io_controller_name": 17,
"strimzi_io_controller_role": 18,
"strimzi_io_kind": 19,
"strimzi_io_name": 20,
"strimzi_io_pod_name": 21,
"strimzi_io_pool_name": 22,
"topic": 2
},
"renameByName": {
"Value": "Log Size",
"partition": "Partition",
"strimzi_io_name": "",
"topic": "Topic"
}
}
}
],
"type": "table"
}
],
"preload": false,
"refresh": "5s",
"schemaVersion": 41,
"tags": [
"Strimzi",
"Kafka"
],
"templating": {
"list": [
{
"current": {
"text": "Prometheus",
"value": "prometheus"
},
"includeAll": false,
"label": "datasource",
"name": "DS_PROMETHEUS",
"options": [],
"query": "prometheus",
"refresh": 1,
"regex": "",
"type": "datasource"
},
{
"current": {
"text": "kafka-operator",
"value": "kafka-operator"
},
"datasource": "${DS_PROMETHEUS}",
"definition": "",
"includeAll": false,
"label": "Namespace",
"name": "kubernetes_namespace",
"options": [],
"query": "query_result(kafka_server_replicamanager_leadercount)",
"refresh": 1,
"regex": "/.*namespace=\"([^\"]*).*/",
"type": "query"
},
{
"current": {
"text": "",
"value": ""
},
"datasource": "${DS_PROMETHEUS}",
"definition": "",
"includeAll": false,
"label": "Cluster Name",
"name": "strimzi_cluster_name",
"options": [],
"query": "query_result(kafka_server_replicamanager_leadercount{namespace=\"$kubernetes_namespace\"})",
"refresh": 1,
"regex": "/.*strimzi_io_cluster=\"([^\"]*).*/",
"type": "query"
},
{
"allValue": ".*",
"current": {
"text": "All",
"value": "$__all"
},
"datasource": "${DS_PROMETHEUS}",
"definition": "",
"includeAll": true,
"label": "Broker",
"name": "kafka_broker",
"options": [],
"query": "query_result(kafka_server_replicamanager_leadercount{namespace=\"$kubernetes_namespace\",strimzi_io_cluster=\"$strimzi_cluster_name\"})",
"refresh": 1,
"regex": "/.*pod_name=\"$strimzi_cluster_name-([^\"]*).*/",
"type": "query"
},
{
"allValue": ".+",
"current": {
"text": "All",
"value": "$__all"
},
"datasource": "${DS_PROMETHEUS}",
"definition": "",
"includeAll": true,
"label": "Topic",
"name": "kafka_topic",
"options": [],
"query": "query_result(kafka_cluster_partition_replicascount{namespace=\"$kubernetes_namespace\",strimzi_io_cluster=\"$strimzi_cluster_name\",kubernetes_pod_name=~\"$strimzi_cluster_name-$kafka_broker\"})",
"refresh": 1,
"regex": "/.*topic=\"([^\"]*).*/",
"type": "query"
},
{
"allValue": ".*",
"current": {
"text": "All",
"value": "$__all"
},
"datasource": "${DS_PROMETHEUS}",
"definition": "",
"includeAll": true,
"label": "Partition",
"multi": true,
"name": "kafka_partition",
"options": [],
"query": "query_result(kafka_log_log_size{namespace=\"$kubernetes_namespace\",strimzi_io_cluster=\"$strimzi_cluster_name\",kubernetes_pod_name=~\"$strimzi_cluster_name-$kafka_broker\",topic=~\"$kafka_topic\"})",
"refresh": 1,
"regex": "/.*partition=\"([^\"]*).*/",
"sort": 3,
"type": "query"
}
]
},
"time": {
"from": "now-1h",
"to": "now"
},
"timepicker": {},
"timezone": "",
"title": "03-2 - Strimzi Kafka",
"uid": "fffdb6cd-0116-4daa-b60d-aedc85dec891",
"version": 14
}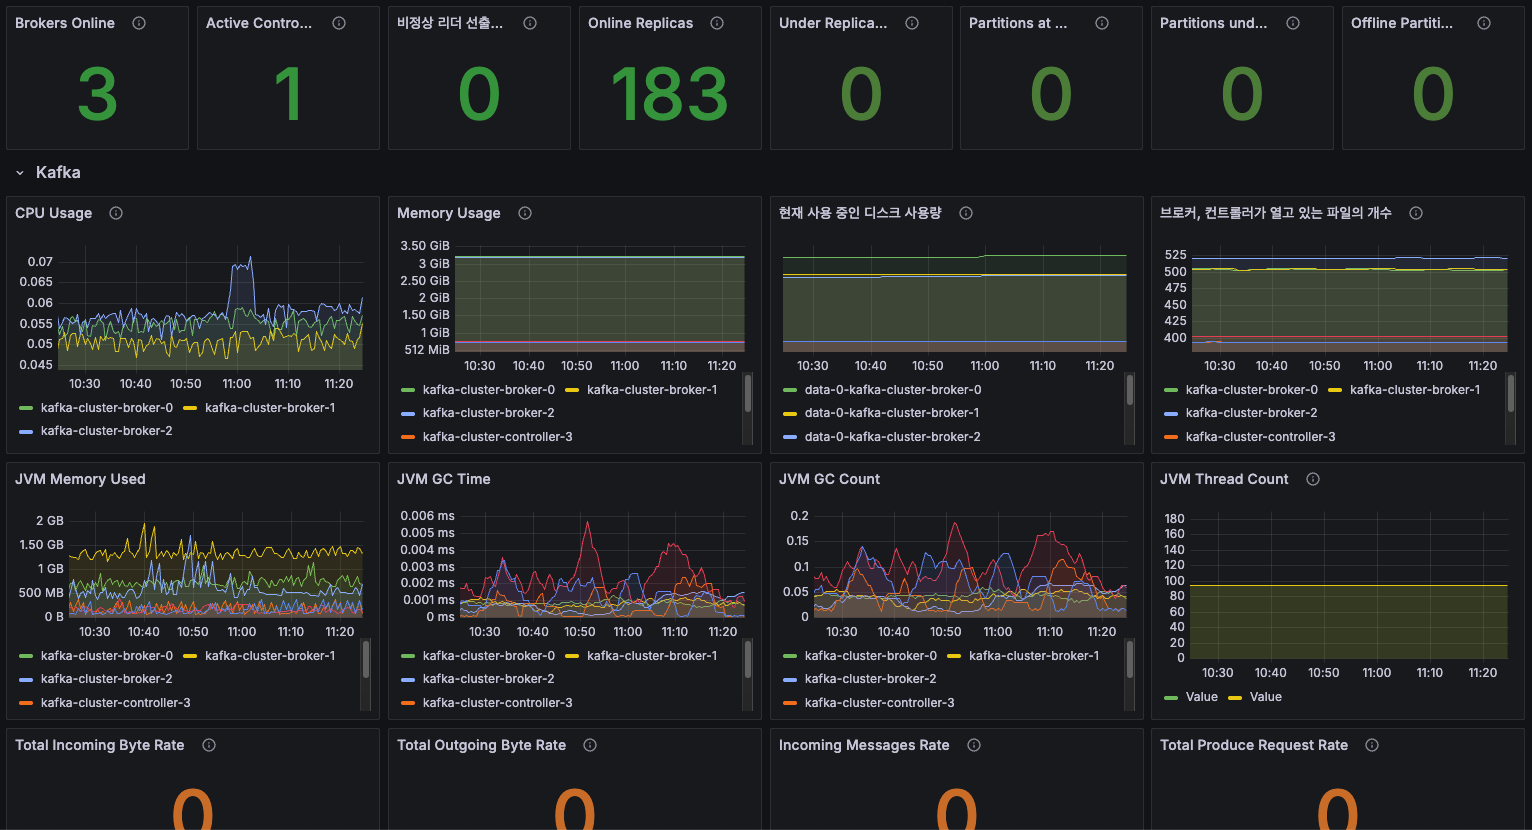
그럼 이렇게 대시보드가 나오는 것을 확인 할 수 있습니다.
대시보드의 내용은 각자 입맛에 맞춰 수정을 하시면 됩니다.
이상 입니다.
'Kafka' 카테고리의 다른 글
| Kafka 스키마 레지스트리란 무엇인가? (0) | 2026.02.26 |
|---|---|
| Strimzi Kafka + Debezium으로 MySQL CDC 구축하기 (0) | 2026.02.24 |
| Strimzi Kafka mTLS 적용 알아보기 (0) | 2025.12.03 |
| AWS MSK 메트릭 수집 및 모니터링 (0) | 2025.11.06 |
| Kafka 리플리케이션 완벽 이해: 동작 원리부터 토픽 설정까지 (0) | 2025.10.31 |